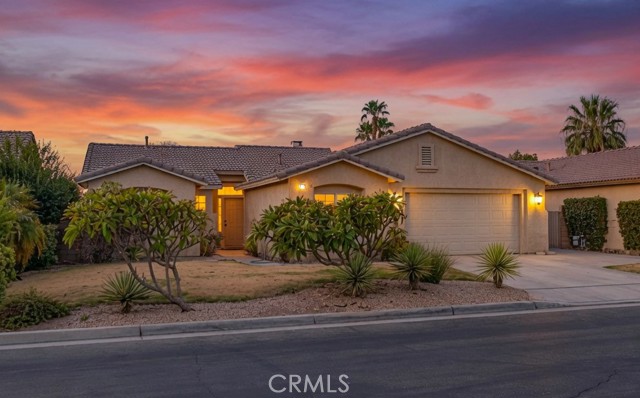
79389 Paseo Del Rey, La Quinta, CA 92253
79389 Paseo Del Rey, La Quinta, CA 92253
Property Description
The perfect home! FHA Approved! Step into a home where every day feels like a getaway. Tucked away in a desirable La Quinta neighborhood, this beautifully maintained property offers the perfect blend of comfort, style, and effortless desert living. Whether you're searching for your forever home, a seasonal retreat, or a smart investment, this is the kind of opportunity buyers wait for don't let it be the one that got away.
Features & Amenities
Property Details
Mortgage Calculator
Current Rates
About Aliso
This property is located in Aliso, a community in La Quinta. Explore more listings in this neighborhood to compare options and pricing.
View Aliso ListingsComparative Market Analysis
Residential Tier · 5 active · 5 closed
Aliso · La Quinta · Single Family Residence
Listed in line with the median closed sale of $550,000. Price per sqft ($269) is a 12% discount to closed comps ($307).
Price Position
Aligned with the market — fair pricing for the comps.
Active Properties (5)
Active Comparables
| Address | City | Year | BD | BTH | SqFt | LotSz | LP/SqFt | LP | DIM | Score |
|---|---|---|---|---|---|---|---|---|---|---|
| 53305 Avenida Madero | La Quinta | 2001 | 3 | 2 | 1,691 | 7,405 | $384 | $650,000 | 16 | 74 |
| 45210 Desert Hills Court | La Quinta | 1994 | 3 | 2 | 1,700 | 7,841 | $376 | $639,000 | 3 | 72 |
| 78815 Sunbrook Lane | La Quinta | 1997 | 4 | 2 | 1,696 | 8,276 | $383 | $649,900 | 4 | 69 |
| 54820 Avenida Ramirez | La Quinta | 1997 | 3 | 2 | 1,613 | 5,227 | $310 | $499,900 | 32 | 69 |
| 44335 Monticello Avenue | La Quinta | 2002 | 4 | 2 | 1,722 | 8,712 | $363 | $625,000 | 58 | 69 |
| Total: 5 · Average | 3.4 | 2.0 | 1,684.4 | 7,492.2 | $363.2 | $612,760 | 22.6 | |||
| Median | 1,696 | $639,000 | ||||||||
Closed Properties (5)
Closed Comparables
| Address | City | Year | Date | BD | BTH | SqFt | LotSz | LP | SP | SP/SqFt | SP/LP | DIM | Score |
|---|---|---|---|---|---|---|---|---|---|---|---|---|---|
| 79190 Ladera Drive | La Quinta | 1995 | 10/02/2026 | 3 | 2 | 1,968 | 8,276 | $595,000 | $565,000 | $287 | 0.95 | 181 | 74 |
| 44535 Via Del Monte | La Quinta | 1990 | 09/16/2026 | 3 | 2 | 2,202 | 7,405 | $575,000 | $550,000 | $250 | 0.96 | 66 | 72 |
| 45120 Desert Fox Drive | La Quinta | 1994 | 09/16/2026 | 3 | 2 | 1,653 | 7,405 | $550,000 | $545,000 | $330 | 0.99 | 55 | 72 |
| 45400 Ashwood Court | La Quinta | 1999 | 09/30/2026 | 4 | 2 | 2,008 | 10,454 | $699,000 | $685,000 | $341 | 0.98 | 59 | 71 |
| 60200 Wishbone Court | La Quinta | 2003 | 09/21/2026 | 2 | 2 | 1,693 | 7,841 | $589,000 | $550,000 | $325 | 0.93 | 142 | 70 |
| Total: 5 · Average | 3.0 | 2.0 | 1,904.8 | 8,276.2 | $579,000 | $579,000 | $306.6 | — | 100.6 | ||||
| Median | 1,968 | $550,000 | $550,000 | ||||||||||
Market Analysis
List vs Sale $/SqFt
Sale Price Trend
Days on Market
Sale vs List Price
This analysis was generated automatically from MLS data. For an in-depth, human-reviewed valuation, contact Joseph Sardella at josephsardella@gmail.com.