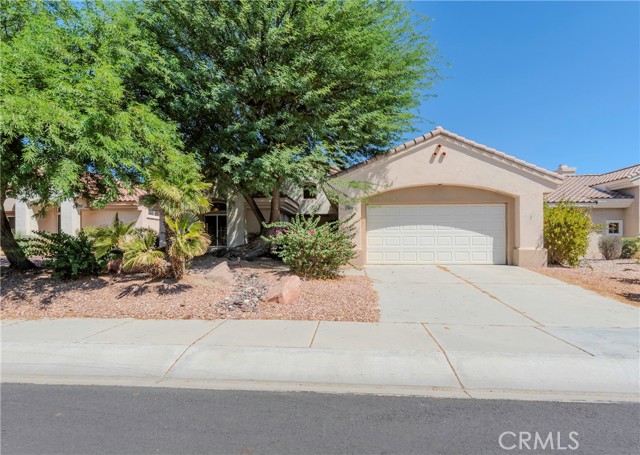
78088 Foxbrook LN, Palm Desert, CA 92211
78088 Foxbrook LN, Palm Desert, CA 92211
Property Description
Welcome to this home in Sun City Palm Desert 55+ Community. This well-appointed home offers a comfortable and inviting layout. The spacious floor plan provides plenty of room for everyday living and entertaining, while the peaceful surroundings offer the ideal setting for enjoying the best of the desert lifestyle. Residents of Sun City Palm Desert enjoy an exceptional array of amenities, including multiple pools and spas, fitness facilities, golf, tennis, pickleball, clubhouse facilities, social activities, numerous clubs and community events. Conveniently located near shopping, dining, entertainment, and everything Palm Desert has to offer. This home is an excellent opportunity to enjoy resort-style living. Don't miss the opportunity to make Sun City Palm Desert your own!
Features & Amenities
Property Details
Mortgage Calculator
Current Rates
About Sun City
This property is located in Sun City, a community in Palm Desert. Explore more listings in this neighborhood to compare options and pricing.
View Sun City ListingsComparative Market Analysis
Residential Tier · 5 active · 0 closed
Sun City · Palm Desert · Single Family Residence
Comparable sales support the current list price.
Price Position
Aligned with the market — fair pricing for the comps.
Active Properties (5)
Active Comparables
| Address | City | Year | BD | BTH | SqFt | LotSz | LP/SqFt | LP | DIM | Score |
|---|---|---|---|---|---|---|---|---|---|---|
| 78291 Hollister Drive | Palm Desert | 2001 | 2 | 2 | 1,622 | 6,534 | $299 | $484,824 | 25 | 95 |
| 35115 Staccato Street | Palm Desert | 2003 | 2 | 2 | 1,616 | 5,663 | $340 | $549,000 | 78 | 94 |
| 78528 Sunrise Canyon Avenue | Palm Desert | 2000 | 2 | 2 | 2,032 | 6,970 | $273 | $555,000 | 45 | 94 |
| 37338 Turnberry Isle Drive | Palm Desert | 1999 | 2 | 2 | 2,102 | 6,534 | $238 | $500,000 | 171 | 93 |
| 78275 Estancia Drive | Palm Desert | 2001 | 2 | 2 | 1,616 | 5,663 | $278 | $449,000 | 210 | 93 |
| Total: 5 · Average | 2.0 | 2.0 | 1,797.6 | 6,272.8 | $285.6 | $507,564.8 | 105.8 | |||
| Median | 1,622 | $500,000 | ||||||||
Market Analysis
List vs Sale $/SqFt
Sale Price Trend
Days on Market
Sale vs List Price
This analysis was generated automatically from MLS data. For an in-depth, human-reviewed valuation, contact Joseph Sardella at josephsardella@gmail.com.