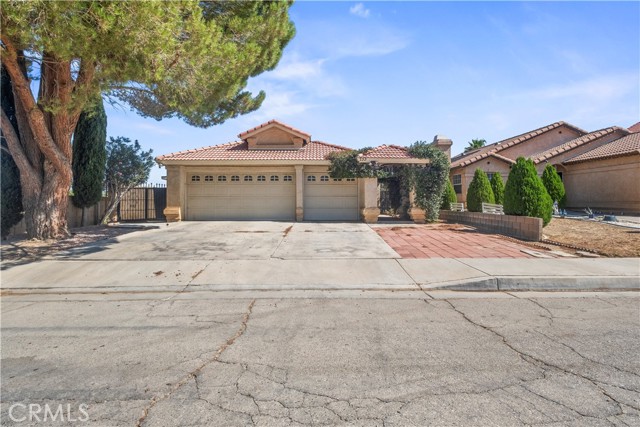
733 East Avenue J12, Lancaster, CA 93535
733 East Avenue J12, Lancaster, CA 93535
Property Description
*This Property May Qualify for Zero % Down Financing! Welcome Home to this spacious Lancaster Home! Priced To Sell! 3 large bedrooms , 2 full Bathrooms, with a Bonus Room, could be an Office, Playroom or Guest Room. Remodeled kitchen added sliding door exits to an End to End Covered Patio for enjoying the Antelope Valley's Summer Nights. Roomy Backyard includes grass and a large shed to store your tools. Home sits on a quiet culdesac. Home is a must see! Comes with an Assumable Solar Lease with added batteries for extra convenience. Sellers will review all offers.
Features & Amenities
Property Details
Mortgage Calculator
Current Rates
Comparative Market Analysis
Affordable Tier · 5 active · 5 closed
Lancaster · Single Family Residence
Listed 5.9% above the median closed sale of $425,000. Price per sqft ($248) is a 14% discount to closed comps ($287).
Price Position
Positioned above the market — commands a premium.
Active Properties (5)
Active Comparables
| Address | City | Year | BD | BTH | SqFt | LotSz | LP/SqFt | LP | DIM | Score |
|---|---|---|---|---|---|---|---|---|---|---|
| 1046 Avenue J6 | Lancaster | 1985 | 3 | 2 | 1,781 | 8,072 | $247 | $440,000 | 69 | 88 |
| 1146 Chagal | Lancaster | 1987 | 3 | 2 | 1,707 | 5,802 | $249 | $425,000 | 155 | 87 |
| 660 Avenue J10 | Lancaster | 1987 | 3 | 3 | 1,766 | 8,291 | $283 | $499,000 | 111 | 87 |
| 1111 Herzel | Lancaster | 1987 | 4 | 2 | 1,521 | 5,761 | $279 | $424,900 | 27 | 85 |
| 43815 Gillan | Lancaster | 1986 | 3 | 2 | 1,422 | 6,894 | $316 | $449,000 | 174 | 84 |
| Total: 5 · Average | 3.2 | 2.2 | 1,639.4 | 6,964 | $274.8 | $447,580 | 107.2 | |||
| Median | 1,707 | $440,000 | ||||||||
Closed Properties (5)
Closed Comparables
| Address | City | Year | Date | BD | BTH | SqFt | LotSz | LP | SP | SP/SqFt | SP/LP | DIM | Score |
|---|---|---|---|---|---|---|---|---|---|---|---|---|---|
| 1012 Chagal | Lancaster | 1986 | 09/04/2026 | 3 | 2 | 1,422 | 7,889 | $395,000 | $395,000 | $278 | 1.00 | 57 | 86 |
| 1123 Herzel Avenue | Lancaster | 1987 | 06/16/2026 | 3 | 2 | 1,502 | 0 | $435,000 | $430,000 | $286 | 0.99 | 47 | 85 |
| 1144 Avenue J10 | Lancaster | 1987 | 07/02/2026 | 3 | 2 | 1,502 | 5,634 | $452,000 | $425,000 | $283 | 0.94 | 262 | 85 |
| 44011 11th | Lancaster | 1988 | 07/31/2026 | 3 | 2 | 1,424 | 7,943 | $399,900 | $410,000 | $288 | 1.02 | 37 | 84 |
| 736 Avenue J6 | Lancaster | 1991 | 07/14/2026 | 3 | 2 | 1,511 | 8,113 | $449,999 | $450,000 | $298 | 1.00 | 84 | 84 |
| Total: 5 · Average | 3.0 | 2.0 | 1,472.2 | 7,394.75 | $422,000 | $422,000 | $286.6 | — | 97.4 | ||||
| Median | 1,502 | $425,000 | $425,000 | ||||||||||
Market Analysis
List vs Sale $/SqFt
Sale Price Trend
Days on Market
Sale vs List Price
This analysis was generated automatically from MLS data. For an in-depth, human-reviewed valuation, contact Joseph Sardella at josephsardella@gmail.com.