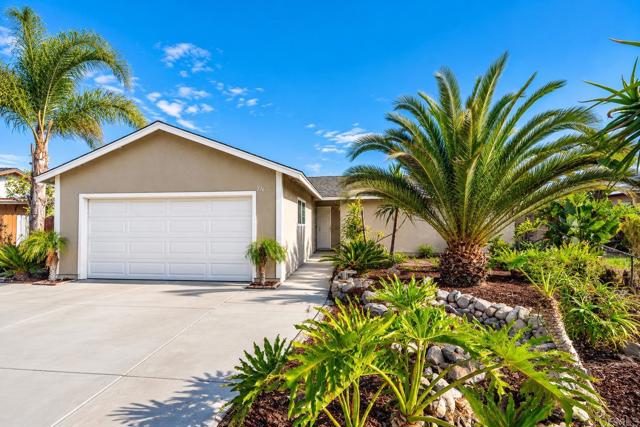
716 Rena Drive, Oceanside, CA 92057
716 Rena Drive, Oceanside, CA 92057
Property Description
Welcome Home to Quiet Cul-de-Sac Living. Tucked away on a peaceful cul-de-sac in Oceanside, this single-family home offers the kind of street where neighbors wave, kids play, and traffic is rarely a concern. Move-in ready and thoughtfully updated, 716 Rena Dr is ready for its next chapter. Step inside to fresh, updated flooring that flows throughout the home, creating a clean, cohesive feel. The kitchen features stainless steel appliances, making everyday cooking and entertaining a pleasure. The bathrooms have been updated with modern finishes, so there’s nothing to do but unpack. Year-round comfort is covered with newer central heat and air conditioning, a valuable upgrade that offers peace of mind and efficiency in every season. Enjoy the best of coastal Southern California living, with beaches, shopping, dining, and commuter routes all within easy reach of this tranquil retreat.
Features & Amenities
Property Details
Mortgage Calculator
Current Rates
Comparative Market Analysis
Affordable Tier · 5 active · 5 closed
Oceanside · Single Family Residence
Listed 5.4% below the median closed sale of $782,450. Closed comps sold at 101% of list — strong seller's market.
Price Position
Priced below the market — value advantage over the field.
Active Properties (5)
Active Comparables
| Address | City | Year | BD | BTH | SqFt | LotSz | LP/SqFt | LP | DIM | Score |
|---|---|---|---|---|---|---|---|---|---|---|
| 630 Ann Street | Oceanside | 1970 | 3 | 2 | 1,074 | 6,200 | $745 | $799,900 | 11 | 96 |
| 722 Isidore Street | Oceanside | 1986 | 3 | 2 | 1,210 | 9,622 | $702 | $849,000 | 13 | 92 |
| 652 Parker | Oceanside | 1968 | 4 | 2 | 1,192 | 6,900 | $654 | $779,000 | 20 | 90 |
| 4932 Verde Drive | Oceanside | 1964 | 3 | 2 | 988 | 7,300 | $697 | $689,000 | 35 | 85 |
| 652 Irene Road | Oceanside | 1986 | 4 | 2 | 1,441 | 9,583 | $590 | $849,999 | 53 | 82 |
| Total: 5 · Average | 3.4 | 2.0 | 1,181 | 7,921 | $677.6 | $793,379.8 | 26.4 | |||
| Median | 1,192 | $799,900 | ||||||||
Closed Properties (5)
Closed Comparables
| Address | City | Year | Date | BD | BTH | SqFt | LotSz | LP | SP | SP/SqFt | SP/LP | DIM | Score |
|---|---|---|---|---|---|---|---|---|---|---|---|---|---|
| 4907 Stephanie Pl | Oceanside | 1970 | 05/18/2026 | 3 | 2 | 1,074 | 8,400 | $798,000 | $820,000 | $764 | 1.03 | 37 | 92 |
| 5146 Parker | Oceanside | 1974 | 08/10/2026 | 4 | 2 | 1,352 | 15,000 | $825,000 | $820,000 | $607 | 0.99 | 110 | 88 |
| 656 Parker Street | Oceanside | 1968 | 07/31/2026 | 4 | 2 | 1,239 | 7,000 | $749,000 | $765,000 | $617 | 1.02 | 56 | 87 |
| 4969 Stephanie Pl | Oceanside | 1969 | 07/01/2026 | 4 | 2 | 1,239 | 10,000 | $760,000 | $760,000 | $613 | 1.00 | 76 | 87 |
| 5133 Greenbrook Street | Oceanside | 1987 | 05/13/2026 | 4 | 2 | 1,279 | 9,106 | $775,000 | $782,450 | $612 | 1.01 | 65 | 84 |
| Total: 5 · Average | 3.8 | 2.0 | 1,236.6 | 9,901.2 | $789,490 | $789,490 | $642.6 | — | 68.8 | ||||
| Median | 1,239 | $782,450 | $782,450 | ||||||||||
Market Analysis
List vs Sale $/SqFt
Sale Price Trend
Days on Market
Sale vs List Price
This analysis was generated automatically from MLS data. For an in-depth, human-reviewed valuation, contact Joseph Sardella at josephsardella@gmail.com.