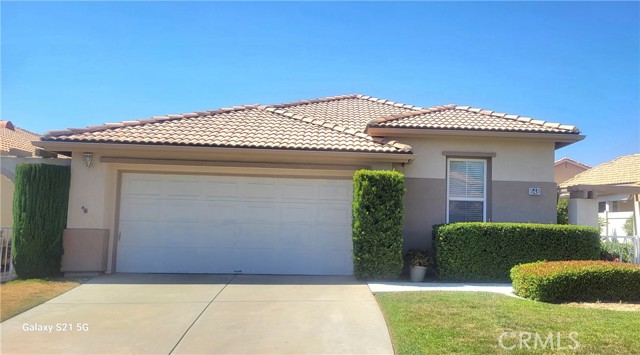
648 Essex Way, Banning, CA 92220
648 Essex Way, Banning, CA 92220
Property Description
The property is located in North side of Sun Lakes Country community, A detached house with 2 Bedroom-2 Full bath, and 2 car attached garage, 1402 sq ft on 4791 sq ft Lot, on the very quite Cul-De-Sac. Spacious Living room with Fireplace, Bright Kitchen with Stainless still Gas Oven, Micrrowave, Dishwasher and Breakfast Bar. Saperated Laundry room in inside with a seiling Fan. The Primary Bedroom has a Walk-In Closet, and a Full bath. The 2nd Bed room has Walk-In Closet. The Sun Lakes Community has Two 18 holes Golf cources and one Driving range with 3 club houses, 3 Indoor/outdoor Pools, a Tennis court, a Bocce Ball, Lounge and Restaurants and much more community facilites.
Features & Amenities
Property Details
Mortgage Calculator
Current Rates
Comparative Market Analysis
Affordable Tier · 5 active · 5 closed
Banning · Single Family Residence
Listed 5.4% below the median closed sale of $369,000.
Price Position
Priced below the market — value advantage over the field.
Active Properties (5)
Active Comparables
| Address | City | Year | BD | BTH | SqFt | LotSz | LP/SqFt | LP | DIM | Score |
|---|---|---|---|---|---|---|---|---|---|---|
| 4968 Oakhurst Avenue | Banning | 1997 | 2 | 2 | 1,402 | 4,356 | $249 | $349,000 | 64 | 98 |
| 507 Brooklawn | Banning | 2002 | 2 | 2 | 1,471 | 4,356 | $244 | $359,000 | 29 | 94 |
| 399 Northwood Ave | Banning | 2003 | 2 | 2 | 1,471 | 4,356 | $217 | $319,000 | 41 | 94 |
| 4860 Rolling Hills | Banning | 2002 | 3 | 2 | 1,471 | 4,792 | $245 | $359,999 | 5 | 94 |
| 4956 ROLLING HILLS Avenue | Banning | 2002 | 2 | 2 | 1,471 | 4,356 | $272 | $400,000 | 94 | 93 |
| Total: 5 · Average | 2.2 | 2.0 | 1,457.2 | 4,443.2 | $245.4 | $357,399.8 | 46.6 | |||
| Median | 1,471 | $359,000 | ||||||||
Closed Properties (5)
Closed Comparables
| Address | City | Year | Date | BD | BTH | SqFt | LotSz | LP | SP | SP/SqFt | SP/LP | DIM | Score |
|---|---|---|---|---|---|---|---|---|---|---|---|---|---|
| 893 Twin Hills | Banning | 2000 | 08/31/2026 | 2 | 2 | 1,294 | 5,227 | $369,000 | $369,000 | $285 | 1.00 | 35 | 95 |
| 770 Twin Hills Dr | Banning | 1996 | 10/16/2026 | 3 | 2 | 1,504 | 5,227 | $349,000 | $321,000 | $213 | 0.92 | 76 | 94 |
| 4923 Links | Banning | 2000 | 08/17/2026 | 2 | 2 | 1,471 | 4,356 | $409,000 | $395,000 | $269 | 0.97 | 49 | 94 |
| 840 Twin Hills Drive | Banning | 1996 | 04/27/2026 | 2 | 2 | 1,504 | 5,227 | $385,000 | $380,000 | $253 | 0.99 | 248 | 94 |
| 4896 Rolling Hills | Banning | 2002 | 06/04/2026 | 2 | 2 | 1,471 | 4,356 | $369,900 | $365,000 | $248 | 0.99 | 55 | 92 |
| Total: 5 · Average | 2.2 | 2.0 | 1,448.8 | 4,878.6 | $366,000 | $366,000 | $253.6 | — | 92.6 | ||||
| Median | 1,471 | $369,000 | $369,000 | ||||||||||
Market Analysis
List vs Sale $/SqFt
Sale Price Trend
Days on Market
Sale vs List Price
This analysis was generated automatically from MLS data. For an in-depth, human-reviewed valuation, contact Joseph Sardella at josephsardella@gmail.com.