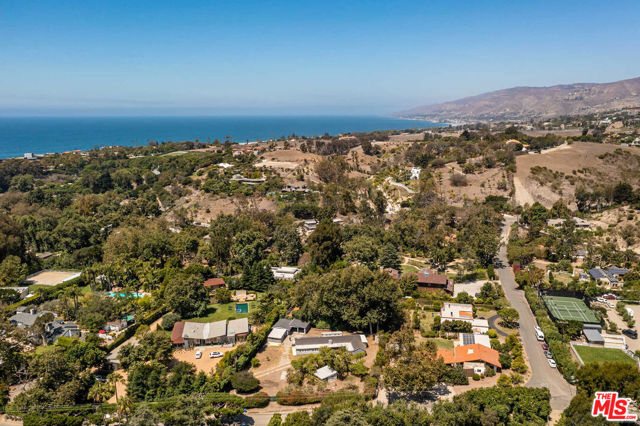
6225 Bonsall Drive, Malibu, CA 90265
6225 Bonsall Drive, Malibu, CA 90265
Property Description
Rare flat 0.6-acre lot in sought-after Bonsall Canyon, one of Malibu's quieter pockets, known for privacy and mature landscape rather than traffic and spectacle. A single-level ranch sits on the property today. Restore it, or start over and build the estate this site can support. Citrus and established trees already frame the lot; Zuma, Westward Beach, and nearby trailheads are minutes away. Opportunities like this rarely come up on a street this sought-after.
Features & Amenities
Property Details
Mortgage Calculator
Current Rates
Comparative Market Analysis
Luxury Tier · 2 active · 5 closed
Malibu · Single Family Residence
Listed 3.3% above the median closed sale of $2,900,000. Price per sqft ($1,754) is a 51% premium to closed comps ($1,165). Closed comps sold at 94% of list — buyers have negotiating leverage. Expect a longer timeline — comps averaged 165 days on market. Luxury tier — fewer comparable sales widen the confidence range.
Price Position
Aligned with the market — fair pricing for the comps.
Active Properties (2)
Active Comparables
| Address | City | Year | BD | BTH | SqFt | LotSz | LP/SqFt | LP | DIM | Score |
|---|---|---|---|---|---|---|---|---|---|---|
| 30601 Sicomoro Drive | Malibu | 1964 | 4 | 3 | 2,652 | 20,186 | $1,225 | $3.25M | 113 | 49 |
| 31254 Bailard Road | Malibu | 1969 | 6 | 4 | 2,865 | 10,061 | $1,045 | $3.00M | 257 | 36 |
| Total: 2 · Average | 5.0 | 3.5 | 2,758.5 | 15,123.5 | $1,135 | $3.12M | 185 | |||
| Median | 2,865 | $3.25M | ||||||||
Closed Properties (5)
Closed Comparables
| Address | City | Year | Date | BD | BTH | SqFt | LotSz | LP | SP | SP/SqFt | SP/LP | DIM | Score |
|---|---|---|---|---|---|---|---|---|---|---|---|---|---|
| 5838 Busch Drive | Malibu | 1963 | 09/02/2026 | 4 | 3 | 2,277 | 21,467 | $3.50M | $3.00M | $1,318 | 0.86 | 168 | 78 |
| 5761 Calpine Drive | Malibu | 1957 | 12/05/2025 | 3 | 2 | 2,502 | 51,683 | $3.30M | $3.25M | $1,299 | 0.98 | 164 | 55 |
| 30630 Morning View Drive | Malibu | 1978 | 05/08/2026 | 3 | 3 | 1,978 | 7,559 | $2.50M | $2.55M | $1,291 | 1.02 | 176 | 54 |
| 6308 Paseo Canyon Drive | Malibu | 1962 | 11/10/2025 | 5 | 4 | 2,164 | 14,116 | $3.00M | $2.90M | $1,340 | 0.97 | 280 | 49 |
| 28935 Beach Lane | Malibu | 2005 | 09/18/2026 | 4 | 4 | 4,437 | 12,883 | $2.99M | $2.55M | $575 | 0.85 | 38 | 45 |
| Total: 5 · Average | 3.8 | 3.2 | 2,671.6 | 21,541.6 | $2.85M | $2.85M | $1,164.6 | — | 165.2 | ||||
| Median | 2,277 | $2.90M | $2.90M | ||||||||||
Market Analysis
List vs Sale $/SqFt
Sale Price Trend
Days on Market
Sale vs List Price
This analysis was generated automatically from MLS data. For an in-depth, human-reviewed valuation, contact Joseph Sardella at josephsardella@gmail.com.