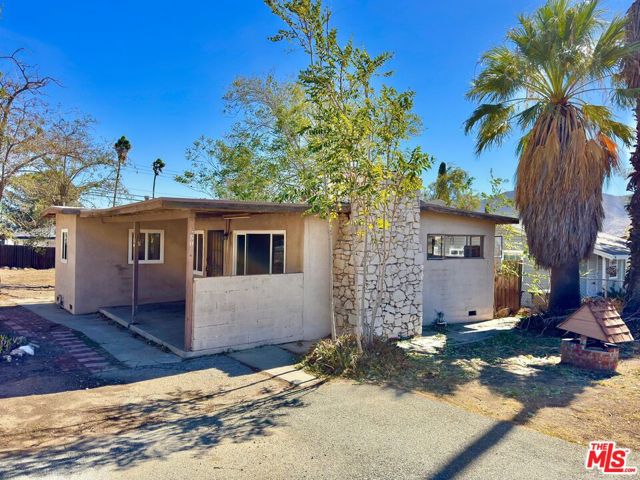
580 North Hargrave Street, Banning, CA 92220
580 North Hargrave Street, Banning, CA 92220
Property Description
Opportunity in Banning! This single-story 2-bedroom, 1-bath home, built in 1957, sits on a generous 7,841 sq ft (0.18 acre) R1 corner lot with mountain views. Approximately 800 sq ft of living space includes a bright living room with a stone wood-burning fireplace, wood-look laminate flooring and ductless mini-split units. The kitchen features white shaker-style cabinets and tile flooring, with an inside laundry area just off the kitchen. Tiled bathroom with tub and shower. Outside you'll find a covered front porch, a covered rear patio, an attached carport and a large fenced yard with mature trees, with plenty of room to garden, play or expand. The home could use some cosmetic updating, making it a great opportunity to add your personal touch and build equity. Close to downtown Banning, shopping, schools and easy I-10 access. Take the 3D tour!
Features & Amenities
Property Details
Mortgage Calculator
Current Rates
Comparative Market Analysis
Affordable Tier · 0 active · 5 closed
Banning · Single Family Residence
Listed in line with the median closed sale of $250,000. Closed comps sold at 93% of list — buyers have negotiating leverage.
Price Position
Aligned with the market — fair pricing for the comps.
Closed Properties (5)
Closed Comparables
| Address | City | Year | Date | BD | BTH | SqFt | LotSz | LP | SP | SP/SqFt | SP/LP | DIM | Score |
|---|---|---|---|---|---|---|---|---|---|---|---|---|---|
| 832 Almond | Banning | 1947 | 08/12/2026 | 2 | 1 | 841 | 6,970 | $279,999 | $250,000 | $297 | 0.89 | 26 | 91 |
| 883 Hargrave | Banning | 1953 | 09/14/2026 | 2 | 1 | 863 | 10,019 | $275,000 | $260,000 | $301 | 0.94 | 39 | 90 |
| 1264 Hargrave | Banning | 1959 | 04/17/2026 | 2 | 1 | 853 | 6,534 | $275,000 | $275,000 | $322 | 1.00 | 55 | 86 |
| 331 Fay Street | Banning | 1945 | 07/16/2026 | 2 | 1 | 780 | 5,663 | $259,900 | $245,500 | $315 | 0.94 | 41 | 86 |
| 450 Martin Street | Banning | 1930 | 03/12/2026 | 2 | 1 | 644 | 6,098 | $249,900 | $215,000 | $334 | 0.86 | 271 | 78 |
| Total: 5 · Average | 2.0 | 1.0 | 796.2 | 7,056.8 | $249,100 | $249,100 | $313.8 | — | 86.4 | ||||
| Median | 841 | $250,000 | $250,000 | ||||||||||
Market Analysis
List vs Sale $/SqFt
Sale Price Trend
Days on Market
Sale vs List Price
This analysis was generated automatically from MLS data. For an in-depth, human-reviewed valuation, contact Joseph Sardella at josephsardella@gmail.com.