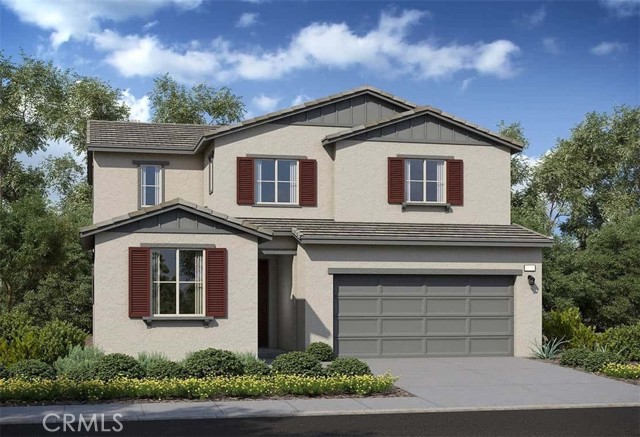
5538 Kiwi Court, Banning, CA 92220
5538 Kiwi Court, Banning, CA 92220
Property Description
Discover the Torrey floor plan, thoughtfully designed to blend modern style, comfort, and versatility. Offering approximately 2,195 sq. ft. of living space, this home features 4 bedrooms and 3 bathrooms, including a convenient first-floor bedroom ideal for guests, extended family, or multi-generational living. Upstairs, a spacious loft provides endless possibilities for a media room, game room, home office, or additional gathering space. An oversized laundry room adds extra convenience, while the flexible layout accommodates a variety of lifestyles. With its functional design and adaptable living spaces, the Torrey is perfect for growing households and modern living. Estimated completion: February/March 2027.
Features & Amenities
Property Details
Mortgage Calculator
Current Rates
Comparative Market Analysis
Residential Tier · 5 active · 5 closed
Banning · Single Family Residence
Listed in line with the median closed sale of $496,500. Closed comps sold at 102% of list — strong seller's market. Expect a longer timeline — comps averaged 147 days on market.
Price Position
Aligned with the market — fair pricing for the comps.
Active Properties (5)
Active Comparables
| Address | City | Year | BD | BTH | SqFt | LotSz | LP/SqFt | LP | DIM | Score |
|---|---|---|---|---|---|---|---|---|---|---|
| 5405 Eureka Avenue | Banning | 2027 | 4 | 3 | 2,282 | 4,688 | $212 | $484,000 | 18 | 96 |
| 5419 Eureka Avenue | Banning | 2027 | 4 | 3 | 2,024 | 4,626 | $231 | $468,000 | 18 | 95 |
| 5518 Kiwi Court | Banning | 2027 | 3 | 3 | 1,957 | 6,274 | $252 | $493,000 | 18 | 94 |
| 1083 Plumwood Lane | Banning | 2026 | 4 | 3 | 2,286 | 5,973 | $238 | $544,000 | 114 | 93 |
| 1131 Rockcress | Banning | 2023 | 4 | 3 | 2,282 | 5,227 | $219 | $499,000 | 43 | 93 |
| Total: 5 · Average | 3.8 | 3.0 | 2,166.2 | 5,357.6 | $230.4 | $497,600 | 42.2 | |||
| Median | 2,282 | $493,000 | ||||||||
Closed Properties (5)
Closed Comparables
| Address | City | Year | Date | BD | BTH | SqFt | LotSz | LP | SP | SP/SqFt | SP/LP | DIM | Score |
|---|---|---|---|---|---|---|---|---|---|---|---|---|---|
| 1627 Hemlock Road | Banning | 2026 | 10/15/2026 | 4 | 3 | 2,024 | 4,202 | $454,000 | $463,996 | $229 | 1.02 | 159 | 95 |
| 5295 Verbena Circle | Banning | 2026 | 06/23/2026 | 4 | 3 | 1,958 | 5,712 | $519,000 | $519,000 | $265 | 1.00 | 97 | 94 |
| 5451 Larkspur Road | Banning | 2026 | 08/21/2026 | 4 | 3 | 2,024 | 4,714 | $475,000 | $493,479 | $244 | 1.04 | 204 | 93 |
| 5226 Tamarack Lane | Banning | 2026 | 07/24/2026 | 4 | 3 | 2,195 | 3,828 | $490,000 | $502,737 | $229 | 1.03 | 128 | 93 |
| 1263 Mahogany Street | Banning | 2026 | 07/02/2026 | 4 | 3 | 1,958 | 6,478 | $499,000 | $496,500 | $254 | 0.99 | 145 | 92 |
| Total: 5 · Average | 4.0 | 3.0 | 2,031.8 | 4,986.8 | $495,142.4 | $495,142.4 | $244.2 | — | 146.6 | ||||
| Median | 2,024 | $496,500 | $496,500 | ||||||||||
Market Analysis
List vs Sale $/SqFt
Sale Price Trend
Days on Market
Sale vs List Price
This analysis was generated automatically from MLS data. For an in-depth, human-reviewed valuation, contact Joseph Sardella at josephsardella@gmail.com.