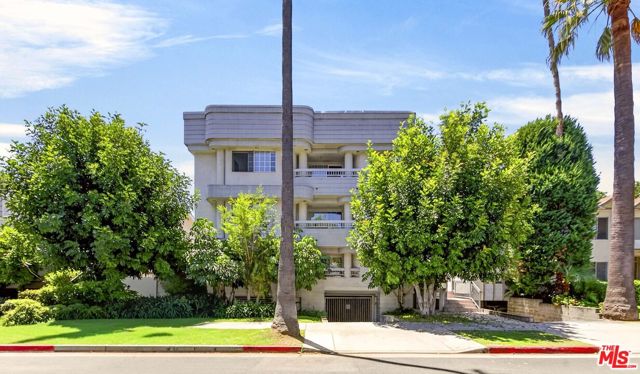
538 Glenwood Road, 1, Glendale, CA 91202
538 Glenwood Road, 1, Glendale, CA 91202
Property Description
Welcome to 538 Glenwood Rd. #1, a beautifully renovated residence in one of Glendale's most desirable neighborhoods. This move in ready home has been thoughtfully updated with brand new laminate flooring, fresh interior paint, and a fully refreshed kitchen featuring new appliances. The bright and inviting interior offers a clean, modern feel with an open and comfortable layout that's perfect for everyday living. Conveniently located near shopping, dining, parks, and major freeways, this home combines style, comfort, and an unbeatable location. Don't miss the opportunity to lease this beautifully updated Glendale home!!
Features & Amenities
Property Details
Mortgage Calculator
Current Rates
Comparative Market Analysis
Affordable Tier · 5 active · 5 closed
Glendale · Condominium
Listed 6.8% below the median closed sale of $750,000. Closed comps sold at 103% of list — strong seller's market.
Price Position
Priced below the market — value advantage over the field.
Active Properties (5)
Active Comparables
| Address | City | Year | BD | BTH | SqFt | LotSz | LP/SqFt | LP | DIM | Score |
|---|---|---|---|---|---|---|---|---|---|---|
| 330 Burchett | Glendale | 1985 | 3 | 2 | 1,282 | 17,235 | $622 | $798,000 | 29 | 85 |
| 551 Stocker Street | Glendale | 1962 | 2 | 2 | 950 | 9,032 | $657 | $624,000 | 83 | 78 |
| 1236 Columbus | Glendale | 1974 | 2 | 2 | 1,163 | 33,451 | $628 | $730,000 | 22 | 76 |
| 1401 Valley View Road | Glendale | 1973 | 2 | 2 | 1,232 | 91,460 | $609 | $750,000 | 39 | 76 |
| 1131 Campbell Street | Glendale | 1994 | 2 | 3 | 1,221 | 0 | $586 | $715,000 | 54 | 76 |
| Total: 5 · Average | 2.2 | 2.2 | 1,169.6 | 37,794.5 | $620.4 | $723,400 | 45.4 | |||
| Median | 1,221 | $730,000 | ||||||||
Closed Properties (5)
Closed Comparables
| Address | City | Year | Date | BD | BTH | SqFt | LotSz | LP | SP | SP/SqFt | SP/LP | DIM | Score |
|---|---|---|---|---|---|---|---|---|---|---|---|---|---|
| 450 Dryden Street | Glendale | 1993 | 05/22/2026 | 3 | 2 | 1,196 | 0 | $689,000 | $750,000 | $627 | 1.09 | 37 | 87 |
| 450 Dryden Street | Glendale | 1993 | 08/26/2026 | 3 | 2 | 1,218 | 14,272 | $699,000 | $755,000 | $620 | 1.08 | 26 | 84 |
| 530 Stocker | Glendale | 2004 | 10/22/2026 | 2 | 2 | 1,350 | 25,934 | $699,000 | $695,000 | $515 | 0.99 | 16 | 84 |
| 1156 San Rafael | Glendale | 1980 | 06/30/2026 | 2 | 2 | 1,283 | 6,216 | $775,000 | $760,000 | $592 | 0.98 | 50 | 81 |
| 1305 Columbus Avenue | Glendale | 1974 | 08/11/2026 | 2 | 2 | 1,385 | 45,102 | $599,000 | $600,000 | $433 | 1.00 | 67 | 79 |
| Total: 5 · Average | 2.4 | 2.0 | 1,286.4 | 22,881 | $712,000 | $712,000 | $557.4 | — | 39.2 | ||||
| Median | 1,283 | $750,000 | $750,000 | ||||||||||
Market Analysis
List vs Sale $/SqFt
Sale Price Trend
Days on Market
Sale vs List Price
This analysis was generated automatically from MLS data. For an in-depth, human-reviewed valuation, contact Joseph Sardella at josephsardella@gmail.com.