1 / 19
504 East Arabella Way, CA 95391
$1.26M5bd · 4ba · 3,102 sqft
Lot 6,952 sqft•Single Family Residence•Active•163d on market•MLS# 01-41118668
504 East Arabella Way, CA 95391
MLS# 01-41118668•Residential•Single Family Residence
Active163 days on market
$1,255,860
5
Beds
4
Baths
3,102
Sq Ft
6,952
Lot Sq Ft
2025
Year Built
Property Description
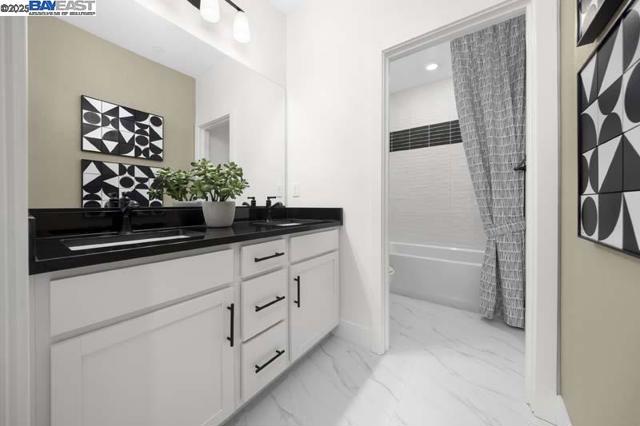
Plan 2 features an open floor plan with covered patio, 2 spacious bedrooms and bathrooms on the main floor. Chef's kitchen, quartz kitchen countertops, white cabinetry, stainless steel Whirlpool appliances and luxury vinyl plank flooring. *Photos are of model home, not actual home*
Features & Amenities
FeeBuilt 2025
Property Details
Subdivision
Other
Land Type
Fee
Year Built
2025
Property Type
Residential
Property Subtype
Single Family Residence
Parking Spaces
2
Garage Spaces
2
Heating
Heat Pump
Cooling
See Remarks
Flooring
Vinyl, Tile
Roof
Shingle
Zip Code
95391
County
San Joaquin
Mortgage Calculator
Current Rates
$
$
%
Monthly Payment
$6,350.31
Principal & Interest
Loan Amount
$1,004,688
Total Interest
$1,281,424
Total Payment Over 30 Years
$2,286,112
This calculator provides estimates only. Actual mortgage payments may include taxes, insurance, HOA fees, and PMI. Contact a lender for accurate quotes.
Comparative Market Analysis
Luxury Tier · 5 active · 5 closed
504 East Arabella Way, CA 95391
Other · · Single Family Residence
$1.26M
Luxury TierBeds
5
Baths
4
Sqft
3,102
Lot
6,952 sqft
Year
2025
$/Sqft
$405
Pool: No✓
Garage: 2-car✓
Listed 17.9% above the median closed sale of $1,065,051. Closed comps sold at 94% of list — buyers have negotiating leverage. Luxury tier — fewer comparable sales widen the confidence range.
Price Position
Positioned above the market — commands a premium.
Premium
Subject listed at $1.26M· $405/sqft
Total list price
Closed comps
vs closed median $1.07M
+$191K (+17.9%)
Active comps
vs active median $1.27M
−$12K (−1.0%)
Price per sqft
Closed compsinsufficient comp data
Active comps
vs active avg $/sqft $376
+$29 (+7.7%)
Active Properties (5)
Active Comparables
| Address | City | Year | BD | BTH | SqFt | LotSz | LP/SqFt | LP | DIM | Score |
|---|---|---|---|---|---|---|---|---|---|---|
| 539 Fiorino Street | 2025 | 5 | 4 | 3,404 | 6,900 | $411 | $1.40M | 199 | 95 | |
| 515 Fiorino Street | 2025 | 5 | 3 | 3,102 | 6,900 | $409 | $1.27M | 321 | 95 | |
| 503 Fiorino Street | 2025 | 5 | 4 | 3,404 | 6,980 | $413 | $1.41M | 321 | 94 | |
| 349 Gobind Blvd | 2025 | 5 | 4 | 2,992 | 6,246 | $400 | $1.20M | 321 | 93 | |
| 1233 Plaza Ct | Tracy | 1998 | 5 | 3 | 3,243 | 7,221 | $247 | $799,999 | 142 | 90 |
| Total: 5 · Average | 5.0 | 3.6 | 3,229 | 6,849.4 | $376 | $1.21M | 260.8 | |||
| Median | 3,243 | $1.27M | ||||||||
Closed Properties (5)
Closed Comparables
| Address | City | Year | Date | BD | BTH | SqFt | LotSz | LP | SP | SP/SqFt | SP/LP | DIM | Score |
|---|---|---|---|---|---|---|---|---|---|---|---|---|---|
| 386 Clydesdale Court | 2025 | 11/28/2025 | 5 | 4 | 2,992 | 6,240 | $1.26M | $1.16M | $388 | 0.92 | 121 | 94 | |
| 607 Huntington Ave | 2017 | 11/17/2025 | 4 | 4 | 2,949 | 5,225 | $1.07M | $1.00M | $339 | 0.94 | 59 | 85 | |
| 350 Clydesdale Court | 2025 | 10/13/2025 | 4 | 3 | 2,562 | 6,240 | $1.16M | $1.07M | $418 | 0.92 | 110 | 84 | |
| 361 Gobind Blvd | 2025 | 09/26/2025 | 4 | 3 | 2,562 | 6,245 | $1.12M | $1.07M | $416 | 0.95 | 93 | 84 | |
| 3229 Jake St | Tracy | 2023 | 10/28/2025 | 4 | 4 | 3,564 | 5,000 | $1.05M | $1.02M | $286 | 0.97 | 79 | 82 |
| Total: 5 · Average | 4.2 | 3.6 | 2,925.8 | 5,790 | $1.06M | $1.06M | $369.4 | — | 92.4 | ||||
| Median | 2,949 | $1.07M | $1.07M | ||||||||||
Market Analysis
List vs Sale $/SqFt
Sale Price Trend
Days on Market
Sale vs List Price
AI-generated CMA
This analysis was generated automatically from MLS data. For an in-depth, human-reviewed valuation, contact Joseph Sardella at josephsardella@gmail.com.