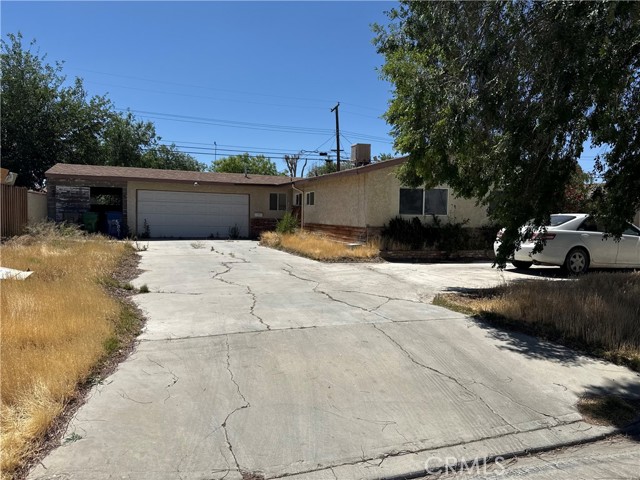
45509 Saigon, Lancaster, CA 93534
45509 Saigon, Lancaster, CA 93534
Property Description
Situated in a well-established Lancaster neighborhood, this property offers a comfortable layout with a practical flow for everyday living. The interior provides a welcoming feel with natural light throughout the main living areas, creating a space that feels both open and easy to enjoy. The kitchen connects smoothly to the living and dining areas, allowing for a natural gathering space. The layout offers flexibility for a variety of living arrangements, whether you are settling in or looking for a solid investment opportunity. The outdoor space provides room to relax, entertain, or personalize to your preference. Located within close proximity to local shopping, dining, and commuter routes, the property offers convenience while maintaining a neighborhood setting. A well-positioned home with comfort, functionality, and long-term potential in a growing Lancaster area.
Features & Amenities
Property Details
Mortgage Calculator
Current Rates
Comparative Market Analysis
Affordable Tier · 5 active · 5 closed
Lancaster · Single Family Residence
Listed 3.8% below the median closed sale of $390,000.
Price Position
Aligned with the market — fair pricing for the comps.
Active Properties (5)
Active Comparables
| Address | City | Year | BD | BTH | SqFt | LotSz | LP/SqFt | LP | DIM | Score |
|---|---|---|---|---|---|---|---|---|---|---|
| 1438 Avenue H-14 | Lancaster | 1955 | 3 | 2 | 1,181 | 6,411 | $322 | $379,900 | 26 | 89 |
| 45351 Kingtree | Lancaster | 1955 | 4 | 2 | 1,206 | 6,004 | $315 | $379,500 | 54 | 84 |
| 45402 10th Street | Lancaster | 1953 | 3 | 1 | 1,150 | 6,969 | $313 | $359,990 | 12 | 83 |
| 45514 12th Street | Lancaster | 1955 | 4 | 2 | 1,287 | 6,636 | $333 | $429,000 | 15 | 82 |
| 1469 Boyden | Lancaster | 1955 | 3 | 2 | 1,594 | 6,733 | $251 | $399,999 | 56 | 80 |
| Total: 5 · Average | 3.4 | 1.8 | 1,283.6 | 6,550.6 | $306.8 | $389,677.8 | 32.6 | |||
| Median | 1,206 | $379,900 | ||||||||
Closed Properties (5)
Closed Comparables
| Address | City | Year | Date | BD | BTH | SqFt | LotSz | LP | SP | SP/SqFt | SP/LP | DIM | Score |
|---|---|---|---|---|---|---|---|---|---|---|---|---|---|
| 1560 Avenue H10 | Lancaster | 1956 | 06/23/2026 | 3 | 2 | 1,040 | 6,788 | $399,900 | $390,000 | $375 | 0.97 | 148 | 92 |
| 1046 Avenue H6 | Lancaster | 1956 | 06/16/2026 | 3 | 2 | 1,118 | 6,249 | $420,000 | $417,000 | $373 | 0.99 | 83 | 88 |
| 1420 Indian Sage Road | Lancaster | 1955 | 05/26/2026 | 3 | 2 | 1,181 | 6,778 | $355,000 | $355,000 | $301 | 1.00 | 82 | 87 |
| 1342 Avenue H15 | Lancaster | 1953 | 04/29/2026 | 3 | 1 | 1,045 | 7,346 | $339,000 | $339,000 | $324 | 1.00 | 104 | 84 |
| 45208 17th | Lancaster | 1963 | 08/04/2026 | 3 | 2 | 1,269 | 6,892 | $385,000 | $390,000 | $307 | 1.01 | 143 | 84 |
| Total: 5 · Average | 3.0 | 1.8 | 1,130.6 | 6,810.6 | $378,200 | $378,200 | $336 | — | 112 | ||||
| Median | 1,118 | $390,000 | $390,000 | ||||||||||
Market Analysis
List vs Sale $/SqFt
Sale Price Trend
Days on Market
Sale vs List Price
This analysis was generated automatically from MLS data. For an in-depth, human-reviewed valuation, contact Joseph Sardella at josephsardella@gmail.com.