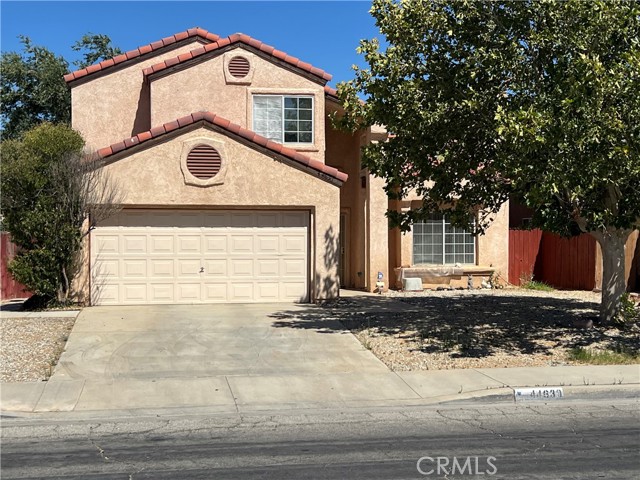
44630 17th E, Lancaster, CA 93535
44630 17th E, Lancaster, CA 93535
Property Description
Welcome to this well-appointed single-family home offering comfort, space, and convenience. Featuring 3 bedrooms and 3 bathrooms, this residence boasts a functional layout with both a spacious living room and a separate family room—perfect for everyday living and entertaining. The living room is highlighted by a cozy fireplace, creating a warm and inviting atmosphere. Additional features include central air conditioning and heating for year-round comfort, as well as a 2-car garage providing ample parking and storage. Step outside to a large backyard with a mature tree, offering plenty of space for outdoor gatherings, gardening, or relaxation. Ideally located within walking distance to Walmart Superstore and boasting a Walk Score of 73, this home offers excellent accessibility to shopping, dining, and everyday conveniences. A fantastic opportunity to own a home that blends comfort, functionality, and a prime location.
Features & Amenities
Property Details
Mortgage Calculator
Current Rates
Comparative Market Analysis
Affordable Tier · 5 active · 5 closed
Lancaster · Single Family Residence
Listed 9.5% below the median closed sale of $420,000. Price per sqft ($240) is a 18% discount to closed comps ($292). Closed comps sold at 101% of list — strong seller's market.
Price Position
Priced below the market — value advantage over the field.
Active Properties (5)
Active Comparables
| Address | City | Year | BD | BTH | SqFt | LotSz | LP/SqFt | LP | DIM | Score |
|---|---|---|---|---|---|---|---|---|---|---|
| 44529 Aspen Street | Lancaster | 1993 | 3 | 3 | 1,637 | 7,157 | $263 | $429,950 | 6 | 94 |
| 1768 Sierra View Avenue | Lancaster | 1989 | 3 | 3 | 1,741 | 6,195 | $247 | $429,999 | 39 | 93 |
| 2113 Lightcap | Lancaster | 1994 | 3 | 2 | 1,601 | 6,758 | $272 | $435,000 | 36 | 91 |
| 1800 Sierra View | Lancaster | 1990 | 3 | 2 | 1,316 | 6,097 | $304 | $399,999 | 7 | 90 |
| 1544 Norberry | Lancaster | 1986 | 3 | 2 | 1,439 | 8,326 | $299 | $429,900 | 102 | 85 |
| Total: 5 · Average | 3.0 | 2.4 | 1,546.8 | 6,906.6 | $277 | $424,969.6 | 38 | |||
| Median | 1,601 | $429,950 | ||||||||
Closed Properties (5)
Closed Comparables
| Address | City | Year | Date | BD | BTH | SqFt | LotSz | LP | SP | SP/SqFt | SP/LP | DIM | Score |
|---|---|---|---|---|---|---|---|---|---|---|---|---|---|
| 44943 16th | Lancaster | 1989 | 09/07/2026 | 3 | 3 | 1,524 | 6,001 | $399,990 | $435,000 | $285 | 1.09 | 38 | 91 |
| 44662 Foxboro Court | Lancaster | 1990 | 08/11/2026 | 3 | 2 | 1,379 | 6,258 | $439,999 | $430,000 | $312 | 0.98 | 82 | 87 |
| 44919 Fenhold | Lancaster | 1990 | 05/01/2026 | 3 | 2 | 1,598 | 6,103 | $425,000 | $420,000 | $263 | 0.99 | 32 | 86 |
| 44629 Pinon Springs | Lancaster | 1986 | 09/01/2026 | 3 | 2 | 1,263 | 7,133 | $419,999 | $410,000 | $325 | 0.98 | 55 | 84 |
| 2028 Greentree | Lancaster | 1993 | 08/05/2026 | 3 | 2 | 1,222 | 5,575 | $335,000 | $335,000 | $274 | 1.00 | 22 | 82 |
| Total: 5 · Average | 3.0 | 2.2 | 1,397.2 | 6,214 | $406,000 | $406,000 | $291.8 | — | 45.8 | ||||
| Median | 1,379 | $420,000 | $420,000 | ||||||||||
Market Analysis
List vs Sale $/SqFt
Sale Price Trend
Days on Market
Sale vs List Price
This analysis was generated automatically from MLS data. For an in-depth, human-reviewed valuation, contact Joseph Sardella at josephsardella@gmail.com.