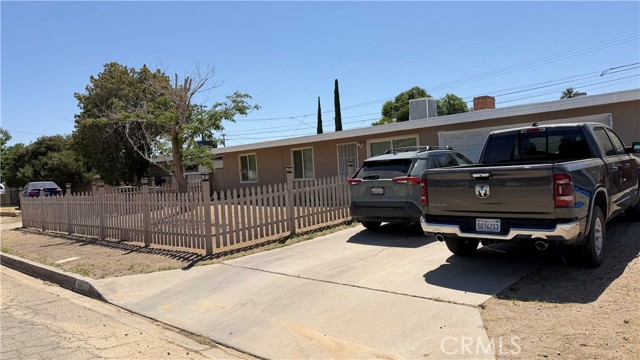
1 / 27
44423 3rd East, Lancaster, CA 93535
$375K3bd · 2ba · 1,188 sqft
Lot 6,381 sqft•Single Family Residence•Active•112d on market•MLS# SR-26148306
44423 3rd East, Lancaster, CA 93535
MLS# SR-26148306•Residential•Single Family Residence
Active112 days on market
$375,000
3
Beds
2
Baths
1,188
Sq Ft
6,381
Lot Sq Ft
1954
Year Built
See Remarks
View
Property Description
GREAT OPPORTUNITY TO FIRST TIME BUYERS OR INVESTORS, BEAUTIFULL POOL HOUSE, READY FOR SUMMER, 3 BED AND 2 BATH, FIREPLACE IN LIVING ROOM, LAUNDRY AREA, NICE BACKYARD, NEED SOME UPDATE, BUT THE HOUSE IS IN GOOD CONDITION.DON'T MISS THIS ONE.
Features & Amenities
FeeBuilt 1954
Property Details
Land Type
Fee
Year Built
1954
Property Type
Residential
Property Subtype
Single Family Residence
Heating
Central
Cooling
Central Air, Evaporative Cooling, None
View
See Remarks
City
Lancaster
Zip Code
93535
County
Los Angeles
Mortgage Calculator
Current Rates
$
$
%
Monthly Payment
$1,896.20
Principal & Interest
Loan Amount
$300,000
Total Interest
$382,633
Total Payment Over 30 Years
$682,633
This calculator provides estimates only. Actual mortgage payments may include taxes, insurance, HOA fees, and PMI. Contact a lender for accurate quotes.
Comparative Market Analysis
Affordable Tier · 5 active · 5 closed
44423 3rd East, Lancaster, CA 93535
Lancaster · Single Family Residence
$375K
Affordable TierBeds
3
Baths
2
Sqft
1,188
Lot
6,381 sqft
Year
1954
$/Sqft
$316
Pool: Yes✓
View: See Remarks✓
Listed 7.4% below the median closed sale of $405,000. Closed comps sold at 105% of list — strong seller's market.
Price Position
Priced below the market — value advantage over the field.
Price advantage
Subject listed at $375K· $316/sqft
Total list price
Closed comps
vs closed median $405K
−$30K (−7.4%)
Active comps
vs active median $399K
−$24K (−6.0%)
Price per sqft
Closed compsinsufficient comp data
Active comps
vs active avg $/sqft $333
−$17 (−5.0%)
Active Properties (5)
Active Comparables
| Address | City | Year | BD | BTH | SqFt | LotSz | LP/SqFt | LP | DIM | Score |
|---|---|---|---|---|---|---|---|---|---|---|
| 44220 Kirkland | Lancaster | 1956 | 3 | 2 | 1,170 | 6,520 | $344 | $403,000 | 98 | 93 |
| 44353 Kirkland | Lancaster | 1955 | 3 | 2 | 1,275 | 6,524 | $314 | $400,000 | 102 | 92 |
| 44258 Foxton | Lancaster | 1955 | 3 | 1 | 1,088 | 6,504 | $349 | $379,900 | 58 | 90 |
| 343 Lingard Street | Lancaster | 1954 | 4 | 2 | 1,254 | 6,611 | $318 | $399,000 | 35 | 89 |
| 44129 Carolside | Lancaster | 1954 | 3 | 1 | 1,036 | 6,912 | $338 | $350,000 | 73 | 87 |
| Total: 5 · Average | 3.2 | 1.6 | 1,164.6 | 6,614.2 | $332.6 | $386,380 | 73.2 | |||
| Median | 1,170 | $399,000 | ||||||||
Closed Properties (5)
Closed Comparables
| Address | City | Year | Date | BD | BTH | SqFt | LotSz | LP | SP | SP/SqFt | SP/LP | DIM | Score |
|---|---|---|---|---|---|---|---|---|---|---|---|---|---|
| 44020 3rd | Lancaster | 1954 | 07/23/2026 | 3 | 2 | 1,165 | 6,628 | $369,999 | $405,000 | $348 | 1.09 | 52 | 91 |
| 44703 2nd Street | Lancaster | 1955 | 07/20/2026 | 3 | 2 | 1,260 | 6,147 | $399,900 | $410,000 | $325 | 1.02 | 35 | 91 |
| 44325 3rd Street | Lancaster | 1952 | 05/22/2026 | 3 | 1 | 1,184 | 5,921 | $374,999 | $375,000 | $317 | 1.00 | 260 | 90 |
| 546 Nugent Street | Lancaster | 1957 | 07/24/2026 | 3 | 2 | 1,107 | 7,041 | $385,000 | $400,000 | $361 | 1.04 | 92 | 89 |
| 44715 Gingham | Lancaster | 1955 | 07/31/2026 | 4 | 2 | 1,170 | 7,154 | $389,999 | $420,000 | $359 | 1.08 | 135 | 88 |
| Total: 5 · Average | 3.2 | 1.8 | 1,177.2 | 6,578.2 | $402,000 | $402,000 | $342 | — | 114.8 | ||||
| Median | 1,170 | $405,000 | $405,000 | ||||||||||
Market Analysis
List vs Sale $/SqFt
Sale Price Trend
Days on Market
Sale vs List Price
AI-generated CMA
This analysis was generated automatically from MLS data. For an in-depth, human-reviewed valuation, contact Joseph Sardella at josephsardella@gmail.com.