1 / 15
44327 23rd West, Lancaster, CA 93536
$400K3bd · 2ba · 1,331 sqft
Lot 7,028 sqft•Single Family Residence•Active•61d on market•MLS# PW-26189827
44327 23rd West, Lancaster, CA 93536
MLS# PW-26189827•Residential•Single Family Residence
Active61 days on market
$400,000
3
Beds
2
Baths
1,331
Sq Ft
7,028
Lot Sq Ft
1957
Year Built
None
View
Property Description
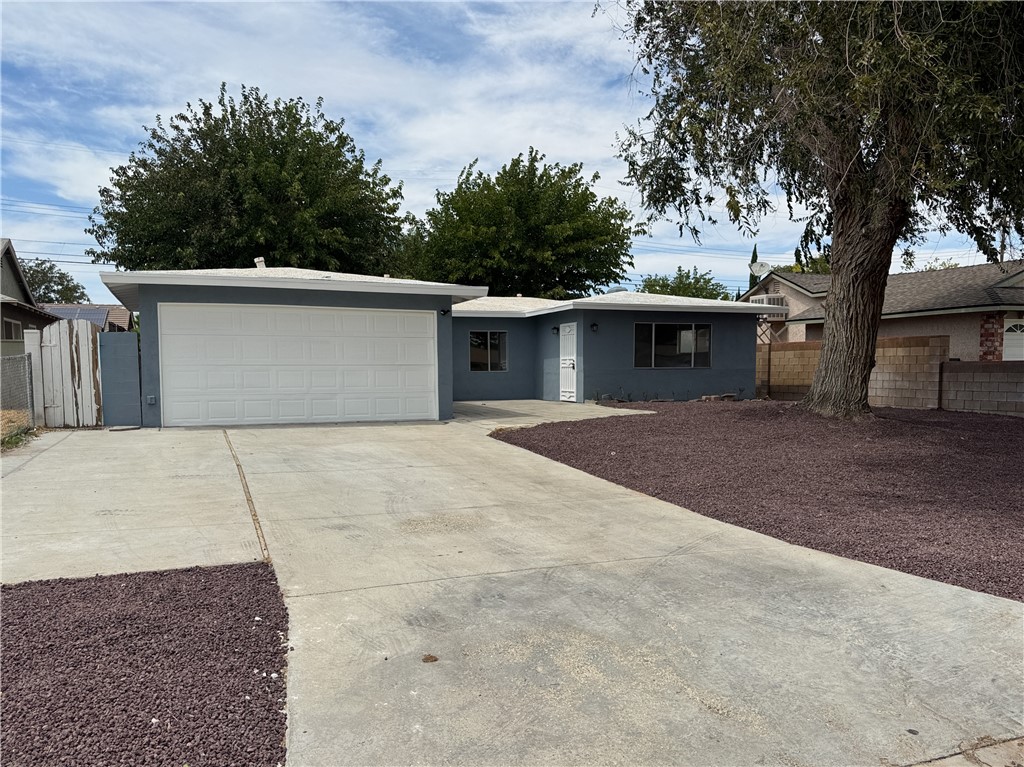
Great opportunity in a good neighborhood of Palmdale. This Home is located on a quiet private Street and features 3 Large bedrooms 2 Full Bathrooms living room family and everything freshly repainted Just Ready to move IN Big backyard for the kids Two car garage with a big driveway
Features & Amenities
FeeBuilt 1957
Property Details
Land Type
Fee
Year Built
1957
Property Type
Residential
Property Subtype
Single Family Residence
Parking Spaces
2
Garage Spaces
2
Cooling
Wall/Window Unit(s)
View
None
City
Lancaster
Zip Code
93536
County
Los Angeles
Mortgage Calculator
Current Rates
$
$
%
Monthly Payment
$2,022.62
Principal & Interest
Loan Amount
$320,000
Total Interest
$408,142
Total Payment Over 30 Years
$728,142
This calculator provides estimates only. Actual mortgage payments may include taxes, insurance, HOA fees, and PMI. Contact a lender for accurate quotes.
Comparative Market Analysis
Affordable Tier · 5 active · 5 closed
44327 23rd West, Lancaster, CA 93536
Lancaster · Single Family Residence
$400K
Affordable TierBeds
3
Baths
2
Sqft
1,331
Lot
7,028 sqft
Year
1957
$/Sqft
$301
Pool: No✓
View: None✓
Garage: 2-car✓
Listed in line with the median closed sale of $405,000. Price per sqft ($301) is a 11% discount to closed comps ($339).
Price Position
Aligned with the market — fair pricing for the comps.
At market
Subject listed at $400K· $301/sqft
Total list price
Closed comps
vs closed median $405K
−$5K (−1.2%)
Active comps
vs active median $449K
−$49K (−10.9%)
Price per sqft
Closed compsinsufficient comp data
Active comps
vs active avg $/sqft $299
+$2 (+0.7%)
Active Properties (5)
Active Comparables
| Address | City | Year | BD | BTH | SqFt | LotSz | LP/SqFt | LP | DIM | Score |
|---|---|---|---|---|---|---|---|---|---|---|
| 44050 27th | Lancaster | 1973 | 3 | 2 | 1,406 | 8,234 | $320 | $449,900 | 128 | 84 |
| 44516 15th | Lancaster | 1957 | 3 | 2 | 1,852 | 7,525 | $221 | $409,000 | 116 | 81 |
| 2317 Edam Street | Lancaster | 1999 | 4 | 2 | 1,403 | 8,347 | $320 | $449,000 | 40 | 78 |
| 44627 Overland Avenue | Lancaster | 1994 | 3 | 2 | 1,045 | 8,276 | $383 | $399,900 | 13 | 77 |
| 2564 Norberry Street | Lancaster | 1994 | 4 | 3 | 1,794 | 7,162 | $251 | $450,000 | 56 | 69 |
| Total: 5 · Average | 3.4 | 2.2 | 1,500 | 7,908.8 | $299 | $431,560 | 70.6 | |||
| Median | 1,406 | $449,000 | ||||||||
Closed Properties (5)
Closed Comparables
| Address | City | Year | Date | BD | BTH | SqFt | LotSz | LP | SP | SP/SqFt | SP/LP | DIM | Score |
|---|---|---|---|---|---|---|---|---|---|---|---|---|---|
| 44338 23rd Street | Lancaster | 1957 | 06/02/2026 | 3 | 2 | 1,014 | 6,970 | $399,000 | $390,000 | $385 | 0.98 | 125 | 87 |
| 44517 21st Street | Lancaster | 1955 | 07/31/2026 | 3 | 1 | 1,060 | 7,735 | $349,000 | $349,000 | $329 | 1.00 | 3 | 83 |
| 2005 Milling | Lancaster | 1955 | 06/13/2026 | 4 | 2 | 1,187 | 7,506 | $398,900 | $405,000 | $341 | 1.01 | 136 | 83 |
| 44333 Albeck | Lancaster | 1985 | 07/22/2026 | 4 | 2 | 1,651 | 6,880 | $445,000 | $445,000 | $270 | 1.00 | 69 | 82 |
| 2101 Dallin Street | Lancaster | 1984 | 09/11/2026 | 3 | 2 | 1,212 | 6,049 | $449,900 | $449,900 | $371 | 1.00 | 67 | 80 |
| Total: 5 · Average | 3.4 | 1.8 | 1,224.8 | 7,028 | $407,780 | $407,780 | $339.2 | — | 80 | ||||
| Median | 1,187 | $405,000 | $405,000 | ||||||||||
Market Analysis
List vs Sale $/SqFt
Sale Price Trend
Days on Market
Sale vs List Price
AI-generated CMA
This analysis was generated automatically from MLS data. For an in-depth, human-reviewed valuation, contact Joseph Sardella at josephsardella@gmail.com.