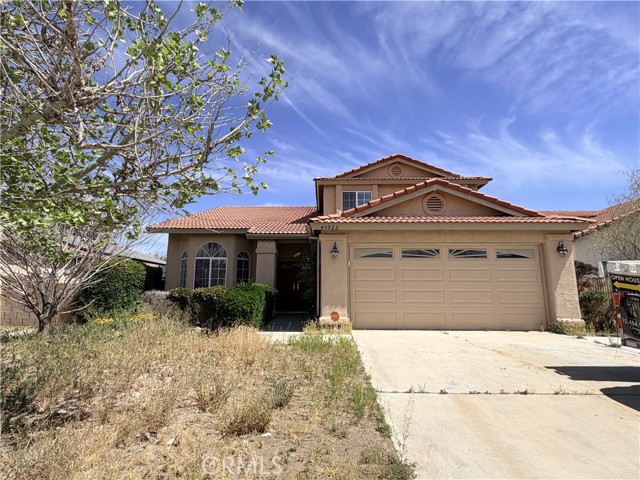
1 / 18
43922 Fallon Drive, Lancaster, CA 93535
$455K4bd · 3ba · 1,829 sqft
Lot 6,227 sqft•Single Family Residence•Active•218d on market•MLS# DW-26063690
43922 Fallon Drive, Lancaster, CA 93535
MLS# DW-26063690•Residential•Single Family Residence
Active218 days on market
$455,000
4
Beds
3
Baths
1,829
Sq Ft
6,227
Lot Sq Ft
1989
Year Built
None
View
Property Description
Great opportunity to own this beautiful & spacious home in a desirable neighborhood. This property features 4 bedrooms, 2½ bathrooms; 2 car garage, covered patio. This home is located in a well establish neighborhood. Property is in need of maintenance and TLC.
Features & Amenities
FeeBuilt 1989
Property Details
Land Type
Fee
Year Built
1989
Property Type
Residential
Property Subtype
Single Family Residence
Parking Spaces
2
Garage Spaces
2
Heating
Central
Cooling
Central Air
View
None
Flooring
Carpet, Wood
Roof
Spanish Tile
City
Lancaster
Zip Code
93535
County
Los Angeles
Mortgage Calculator
Current Rates
$
$
%
Monthly Payment
$2,300.73
Principal & Interest
Loan Amount
$364,000
Total Interest
$464,262
Total Payment Over 30 Years
$828,262
This calculator provides estimates only. Actual mortgage payments may include taxes, insurance, HOA fees, and PMI. Contact a lender for accurate quotes.
Comparative Market Analysis
Affordable Tier · 5 active · 5 closed
43922 Fallon Drive, Lancaster, CA 93535
Lancaster · Single Family Residence
$455K
Affordable TierBeds
4
Baths
3
Sqft
1,829
Lot
6,227 sqft
Year
1989
$/Sqft
$249
Pool: No✓
Spa: Yes✓
View: None✓
Garage: 2-car✓
Listed in line with the median closed sale of $460,000. Closed comps sold at 100% of list — strong seller's market.
Price Position
Aligned with the market — fair pricing for the comps.
At market
Subject listed at $455K· $249/sqft
Total list price
Closed comps
vs closed median $460K
−$5K (−1.1%)
Active comps
vs active median $480K
−$25K (−5.2%)
Price per sqft
Closed compsinsufficient comp data
Active comps
vs active avg $/sqft $234
+$15 (+6.2%)
Active Properties (5)
Active Comparables
| Address | City | Year | BD | BTH | SqFt | LotSz | LP/SqFt | LP | DIM | Score |
|---|---|---|---|---|---|---|---|---|---|---|
| 43753 Rialto | Lancaster | 1988 | 4 | 3 | 1,769 | 9,148 | $271 | $479,900 | 107 | 87 |
| 1642 Bisbee | Lancaster | 1988 | 4 | 3 | 2,325 | 6,306 | $185 | $429,999 | 317 | 86 |
| 1642 Lauterbach | Lancaster | 1984 | 4 | 3 | 2,150 | 8,000 | $233 | $499,900 | 27 | 86 |
| 1303 Chagal | Lancaster | 1984 | 5 | 3 | 2,449 | 7,166 | $204 | $499,999 | 1 | 85 |
| 1111 Herzel | Lancaster | 1987 | 4 | 2 | 1,521 | 5,761 | $279 | $424,900 | 27 | 84 |
| Total: 5 · Average | 4.2 | 2.8 | 2,042.8 | 7,276.2 | $234.4 | $466,939.6 | 95.8 | |||
| Median | 2,150 | $479,900 | ||||||||
Closed Properties (5)
Closed Comparables
| Address | City | Year | Date | BD | BTH | SqFt | LotSz | LP | SP | SP/SqFt | SP/LP | DIM | Score |
|---|---|---|---|---|---|---|---|---|---|---|---|---|---|
| 43927 Fallon Drive | Lancaster | 1989 | 06/26/2026 | 4 | 3 | 1,829 | 6,630 | $469,000 | $464,000 | $254 | 0.99 | 253 | 97 |
| 43920 Comstock Avenue | Lancaster | 1989 | 07/01/2026 | 4 | 3 | 2,055 | 6,165 | $450,000 | $460,000 | $224 | 1.02 | 84 | 90 |
| 1605 Bluebell | Lancaster | 1989 | 05/28/2026 | 4 | 3 | 1,637 | 6,578 | $434,900 | $435,000 | $266 | 1.00 | 48 | 89 |
| 1510 Avenue J12 | Lancaster | 1987 | 10/13/2026 | 4 | 2 | 1,774 | 7,400 | $419,950 | $415,000 | $234 | 0.99 | 57 | 89 |
| 43901 Fallon | Lancaster | 1989 | 08/19/2026 | 5 | 3 | 2,055 | 6,616 | $474,900 | $480,000 | $234 | 1.01 | 72 | 88 |
| Total: 5 · Average | 4.2 | 2.8 | 1,870 | 6,677.8 | $450,800 | $450,800 | $242.4 | — | 102.8 | ||||
| Median | 1,829 | $460,000 | $460,000 | ||||||||||
Market Analysis
List vs Sale $/SqFt
Sale Price Trend
Days on Market
Sale vs List Price
AI-generated CMA
This analysis was generated automatically from MLS data. For an in-depth, human-reviewed valuation, contact Joseph Sardella at josephsardella@gmail.com.