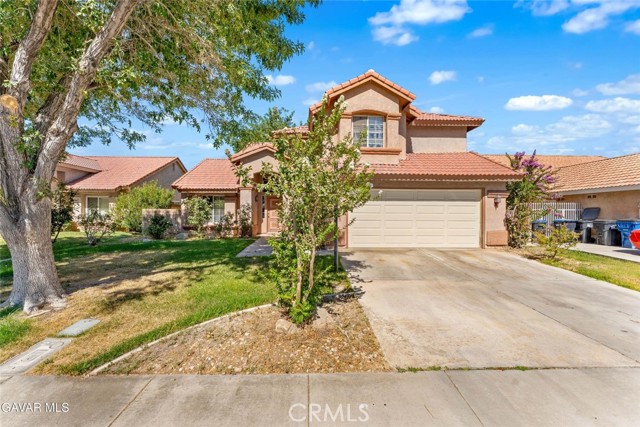
43329 Denmore, Lancaster, CA 93535
43329 Denmore, Lancaster, CA 93535
Property Description
Welcome to this beautiful Lancaster home located in a desirable cul-de-sac neighborhood! This spacious two-story home features 4 bedrooms and 3 bathrooms, offering the perfect amount of space for first-time buyers and growing families. Enjoy a functional and inviting floor plan with a family room, entertainment room, dining area, breakfast bar, perfect for family gatherings, entertaining guests, and creating lasting memories. The home sits on generous 6,824 sq ft lot and features beautiful front and backyard landscaping with sprinklers, plus a relaxing back porch to enjoy outdoor living. Additional features include a 2-car garage and a prime location near schools, shopping centers, restaurants, and freeway access. Don't miss this incredible opportunity to own a spacious home in a great Lancaster neighborhood. Schedule your private showing today before it's gone!
Features & Amenities
Property Details
Mortgage Calculator
Current Rates
Comparative Market Analysis
Residential Tier · 5 active · 5 closed
Lancaster · Single Family Residence
Listed 9.4% above the median closed sale of $480,000. Closed comps sold at 101% of list — strong seller's market.
Price Position
Positioned above the market — commands a premium.
Active Properties (5)
Active Comparables
| Address | City | Year | BD | BTH | SqFt | LotSz | LP/SqFt | LP | DIM | Score |
|---|---|---|---|---|---|---|---|---|---|---|
| 709 Whitlatch | Lancaster | 1989 | 4 | 3 | 2,035 | 7,091 | $241 | $489,990 | 89 | 94 |
| 43502 11th | Lancaster | 1989 | 4 | 3 | 2,244 | 6,330 | $222 | $499,000 | 49 | 92 |
| 43145 Carpenter | Lancaster | 2007 | 4 | 3 | 2,484 | 6,559 | $187 | $464,999 | 48 | 85 |
| 43033 Carpenter | Lancaster | 2005 | 5 | 3 | 2,262 | 9,776 | $212 | $480,000 | 62 | 80 |
| 1154 Avenue K6 | Lancaster | 2005 | 5 | 3 | 3,202 | 7,041 | $186 | $595,000 | 4 | 75 |
| Total: 5 · Average | 4.4 | 3.0 | 2,445.4 | 7,359.4 | $209.6 | $505,797.8 | 50.4 | |||
| Median | 2,262 | $489,990 | ||||||||
Closed Properties (5)
Closed Comparables
| Address | City | Year | Date | BD | BTH | SqFt | LotSz | LP | SP | SP/SqFt | SP/LP | DIM | Score |
|---|---|---|---|---|---|---|---|---|---|---|---|---|---|
| 729 Whitlatch Drive | Lancaster | 1989 | 06/09/2026 | 4 | 3 | 2,035 | 7,060 | $515,000 | $500,000 | $246 | 0.97 | 61 | 94 |
| 43927 Fallon Drive | Lancaster | 1989 | 06/26/2026 | 4 | 3 | 1,829 | 6,630 | $469,000 | $464,000 | $254 | 0.99 | 253 | 87 |
| 43619 Emile Zola Street | Lancaster | 1983 | 05/27/2026 | 4 | 2 | 2,046 | 7,645 | $429,950 | $465,000 | $227 | 1.08 | 36 | 85 |
| 43901 Fallon | Lancaster | 1989 | 08/19/2026 | 5 | 3 | 2,055 | 6,616 | $474,900 | $480,000 | $234 | 1.01 | 72 | 85 |
| 823 Avenue J9 | Lancaster | 1986 | 06/12/2026 | 5 | 3 | 2,016 | 7,379 | $550,000 | $550,000 | $273 | 1.00 | 59 | 84 |
| Total: 5 · Average | 4.4 | 2.8 | 1,996.2 | 7,066 | $491,800 | $491,800 | $246.8 | — | 96.2 | ||||
| Median | 2,035 | $480,000 | $480,000 | ||||||||||
Market Analysis
List vs Sale $/SqFt
Sale Price Trend
Days on Market
Sale vs List Price
This analysis was generated automatically from MLS data. For an in-depth, human-reviewed valuation, contact Joseph Sardella at josephsardella@gmail.com.