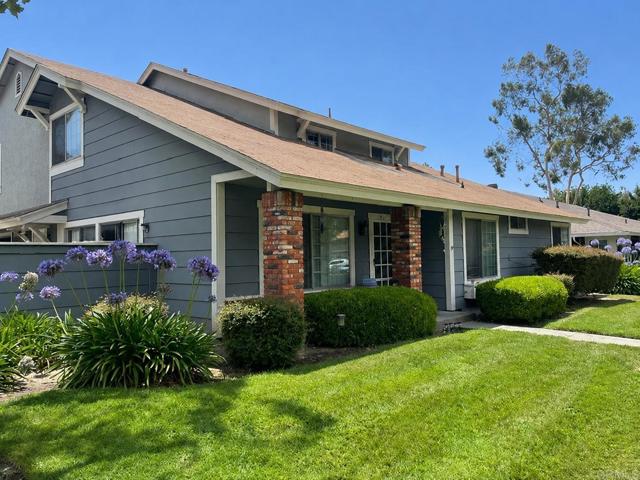
4237 Half Moon Bay Way, Oceanside, CA 92058
4237 Half Moon Bay Way, Oceanside, CA 92058
Property Description
Looking for the best-priced, turnkey home in Oceanside? Well...you found it! Step inside this freshly updated, inviting 3-bedroom, 2-bath townhome in desirable Whelan Ranch. gives you room to spread out. Fresh paint, new luxury vinyl flooring, and an open living area that makes it easy to gather with friends or settle in for a quiet evening. The kitchen shines with new quartzite countertops, a new sink, and updated appliances. New closet doors complete the fresh look. Three bedrooms mean you have options. Make room for overnight guests, create the home office you’ve wanted, or enjoy a little extra space all to yourself. Enjoy a quiet, walkable neighborhood with a community pool, spa, playground, and park, plus the convenience of your own 1-car garage. Camp Pendleton, Oceanside’s beaches, local cafés, downtown, and commuter routes are all nearby. A fresh start. Three bedrooms. The coastal lifestyle you’ve been looking for. Come take a look—and imagine coming home.
Features & Amenities
Property Details
Mortgage Calculator
Current Rates
Comparative Market Analysis
Affordable Tier · 5 active · 5 closed
Oceanside · Condominium
Listed in line with the median closed sale of $559,888. Closed comps sold at 103% of list — strong seller's market.
Price Position
Aligned with the market — fair pricing for the comps.
Active Properties (5)
Active Comparables
| Address | City | Year | BD | BTH | SqFt | LotSz | LP/SqFt | LP | DIM | Score |
|---|---|---|---|---|---|---|---|---|---|---|
| 4267 Arcata Bay | Oceanside | 1982 | 3 | 2 | 1,193 | 111,799 | $419 | $499,999 | 160 | 96 |
| 846 DANA POINT Way | Oceanside | 1988 | 2 | 2 | 1,104 | 0 | $482 | $532,500 | 12 | 93 |
| 631 Persimmon Way | Oceanside | 1985 | 2 | 2 | 1,154 | 363,726 | $468 | $539,900 | 8 | 87 |
| 3553 Coconut Way | Oceanside | 1984 | 2 | 2 | 1,154 | 0 | $459 | $529,900 | 43 | 86 |
| 4226 La Pinata Way | Oceanside | 1987 | 2 | 2 | 1,152 | 308,840 | $486 | $560,000 | 83 | 81 |
| Total: 5 · Average | 2.2 | 2.0 | 1,151.4 | 261,455 | $462.8 | $532,459.8 | 61.2 | |||
| Median | 1,154 | $532,500 | ||||||||
Closed Properties (5)
Closed Comparables
| Address | City | Year | Date | BD | BTH | SqFt | LotSz | LP | SP | SP/SqFt | SP/LP | DIM | Score |
|---|---|---|---|---|---|---|---|---|---|---|---|---|---|
| 814 Shelter Cove Way | Oceanside | 1985 | 09/11/2026 | 3 | 2 | 1,174 | 82,764 | $559,888 | $559,888 | $477 | 1.00 | 40 | 98 |
| 4236 Half Moon Bay | Oceanside | 1984 | 09/10/2026 | 3 | 2 | 1,174 | 133,046 | $550,000 | $560,000 | $477 | 1.02 | 43 | 98 |
| 811 Pillar Point Way | Oceanside | 1988 | 09/01/2026 | 2 | 2 | 1,104 | 116,771 | $485,000 | $485,000 | $439 | 1.00 | 118 | 93 |
| 853 Dana Point Way | Oceanside | 1988 | 02/13/2026 | 3 | 2 | 1,193 | 2 | $499,000 | $560,000 | $469 | 1.12 | 35 | 90 |
| 641 Sumner Way | Oceanside | 2003 | 09/29/2026 | 2 | 2 | 1,141 | 45,302 | $530,000 | $540,000 | $473 | 1.02 | 173 | 88 |
| Total: 5 · Average | 2.6 | 2.0 | 1,157.2 | 75,577 | $540,977.6 | $540,977.6 | $467 | — | 81.8 | ||||
| Median | 1,174 | $559,888 | $559,888 | ||||||||||
Market Analysis
List vs Sale $/SqFt
Sale Price Trend
Days on Market
Sale vs List Price
This analysis was generated automatically from MLS data. For an in-depth, human-reviewed valuation, contact Joseph Sardella at josephsardella@gmail.com.