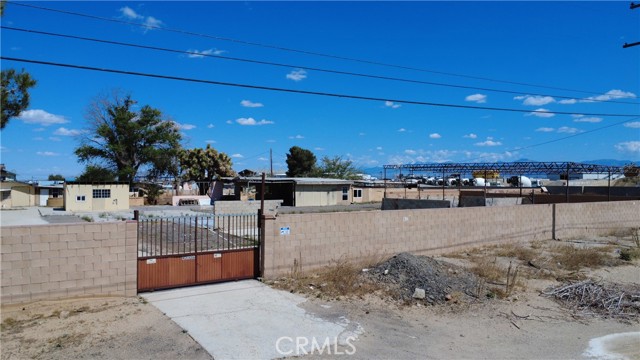
42336 5th Street East, Lancaster, CA 93535
42336 5th Street East, Lancaster, CA 93535
Property Description
Excellent investment opportunity! This 2.21-acre flat lot is zoned LRHI (Light Rural Heavy Industrial), offering a wide range of commercial and industrial possibilities. Located in Lancaster, this property is ideal for investors, developers, or business owners seeking land for industrial use. Zoning allows for potential uses such as warehousing, trucking operations, storage, light manufacturing, and more. Buyer to verify all zoning, use, and development potential with the City of Lancaster or Los Angeles County Planning Department. Neither seller nor listing agent guarantees accuracy of zoning, usage, or property information.
Features & Amenities
Property Details
Mortgage Calculator
Current Rates
Comparative Market Analysis
Affordable Tier · 1 active · 2 closed
Lancaster · Single Family Residence
Listed 4.8% above the median closed sale of $1,187,500. Price per sqft ($996) is a 39% premium to closed comps ($714). Closed comps sold at 88% of list — buyers have negotiating leverage. Expect a longer timeline — comps averaged 179 days on market.
Price Position
Aligned with the market — fair pricing for the comps.
Active Properties (1)
Active Comparables
| Address | City | Year | BD | BTH | SqFt | LotSz | LP/SqFt | LP | DIM | Score |
|---|---|---|---|---|---|---|---|---|---|---|
| 2020 Avenue | Palmdale | 2002 | 5 | 6 | 5,325 | 183,937 | $261 | $1.39M | 105 | 22 |
| Total: 1 · Average | 5.0 | 6.0 | 5,325 | 183,937 | $261 | $1.39M | 105 | |||
| Median | 5,325 | $1.39M | ||||||||
Closed Properties (2)
Closed Comparables
| Address | City | Year | Date | BD | BTH | SqFt | LotSz | LP | SP | SP/SqFt | SP/LP | DIM | Score |
|---|---|---|---|---|---|---|---|---|---|---|---|---|---|
| 42349 5th Street | Lancaster | 1953 | 12/31/2025 | 0 | 0 | 1,058 | 220,746 | $1.40M | $1.15M | $1,087 | 0.82 | 241 | 79 |
| 41121 16th Street | Palmdale | 2020 | 06/04/2025 | 4 | 4 | 3,585 | 109,534 | $1.30M | $1.23M | $342 | 0.94 | 117 | 21 |
| Total: 2 · Average | 2.0 | 2.0 | 2,321.5 | 165,140 | $1.19M | $1.19M | $714.5 | — | 179 | ||||
| Median | 3,585 | $1.23M | $1.23M | ||||||||||
Market Analysis
List vs Sale $/SqFt
Sale Price Trend
Days on Market
Sale vs List Price
This analysis was generated automatically from MLS data. For an in-depth, human-reviewed valuation, contact Joseph Sardella at josephsardella@gmail.com.