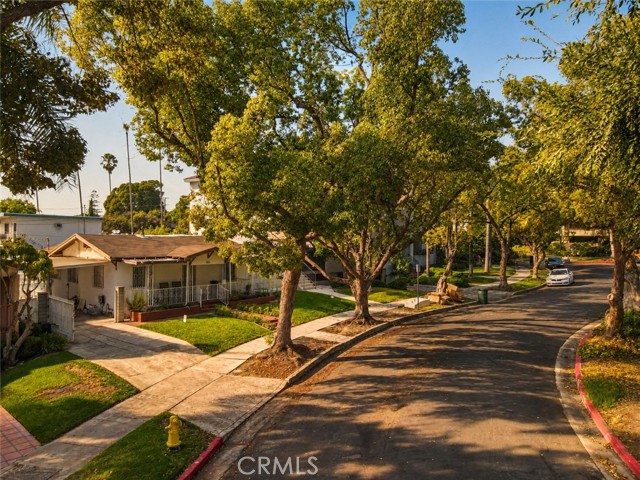
421 Piedmont, Glendale, CA 91206
421 Piedmont, Glendale, CA 91206
Property Description
An outstanding opportunity awaits developers and investors looking to capitalize on a GLR4-zoned property in the heart of Glendale. This versatile zoning supports multi-unit construction, making it an ideal site for a high-density residential development. The current improvements include a charming 3-bed, 1-bath single-family home offering 1,040 sq. ft. of living space on a generous 6,625 sq. ft. lot. Built in 1921, the home carries classic character and sits in a prime location close to schools, shopping, dining, and public transit. With its sizable lot and redevelopment-friendly zoning, the property presents a rare chance to transform the site into a multi-unit residential building. Glendale’s strong rental demand and competitive housing market further enhance the appeal, positioning this parcel as a promising investment with significant long-term upside.
Features & Amenities
Property Details
Mortgage Calculator
Current Rates
Comparative Market Analysis
Affordable Tier · 5 active · 5 closed
Glendale · Single Family Residence
Listed 12.0% below the median closed sale of $1,420,000. Price per sqft ($1,202) is a 39% premium to closed comps ($865). Closed comps sold at 100% of list — strong seller's market.
Price Position
Priced below the market — value advantage over the field.
Active Properties (5)
Active Comparables
| Address | City | Year | BD | BTH | SqFt | LotSz | LP/SqFt | LP | DIM | Score |
|---|---|---|---|---|---|---|---|---|---|---|
| 1534 Broadway | Glendale | 1925 | 3 | 1 | 1,066 | 7,490 | $1,008 | $1.07M | 179 | 84 |
| 1001 Monterey Road | Glendale | 1927 | 3 | 2 | 1,489 | 5,651 | $923 | $1.38M | 69 | 79 |
| 822 Monterey | Glendale | 1931 | 3 | 2 | 1,673 | 7,444 | $655 | $1.09M | 63 | 70 |
| 1620 Ina Drive | Glendale | 1949 | 3 | 2 | 1,577 | 4,101 | $793 | $1.25M | 213 | 63 |
| 443 Woodbury | Glendale | 1973 | 3 | 3 | 2,299 | 5,553 | $542 | $1.25M | 22 | 56 |
| Total: 5 · Average | 3.0 | 2.0 | 1,620.8 | 6,047.8 | $784.2 | $1.21M | 109.2 | |||
| Median | 1,577 | $1.25M | ||||||||
Closed Properties (5)
Closed Comparables
| Address | City | Year | Date | BD | BTH | SqFt | LotSz | LP | SP | SP/SqFt | SP/LP | DIM | Score |
|---|---|---|---|---|---|---|---|---|---|---|---|---|---|
| 239 Everett Street | Glendale | 1927 | 08/14/2026 | 2 | 2 | 1,151 | 3,833 | $1.09M | $1.14M | $990 | 1.04 | 30 | 80 |
| 728 Cordova Avenue | Glendale | 1925 | 04/06/2026 | 3 | 3 | 1,662 | 6,629 | $1.48M | $1.44M | $865 | 0.97 | 63 | 73 |
| 920 Coronado Drive | Glendale | 1927 | 12/10/2025 | 3 | 2 | 1,604 | 5,687 | $1.35M | $1.32M | $826 | 0.98 | 89 | 70 |
| 520 Howard Street | Glendale | 1936 | 05/06/2026 | 3 | 3 | 1,600 | 7,691 | $1.43M | $1.43M | $894 | 1.00 | 99 | 67 |
| 989 Coronado Drive | Glendale | 1928 | 11/18/2025 | 3 | 2 | 1,888 | 6,353 | $1.40M | $1.42M | $752 | 1.01 | 39 | 63 |
| Total: 5 · Average | 2.8 | 2.4 | 1,581 | 6,038.6 | $1.35M | $1.35M | $865.4 | — | 64 | ||||
| Median | 1,604 | $1.42M | $1.42M | ||||||||||
Market Analysis
List vs Sale $/SqFt
Sale Price Trend
Days on Market
Sale vs List Price
This analysis was generated automatically from MLS data. For an in-depth, human-reviewed valuation, contact Joseph Sardella at josephsardella@gmail.com.