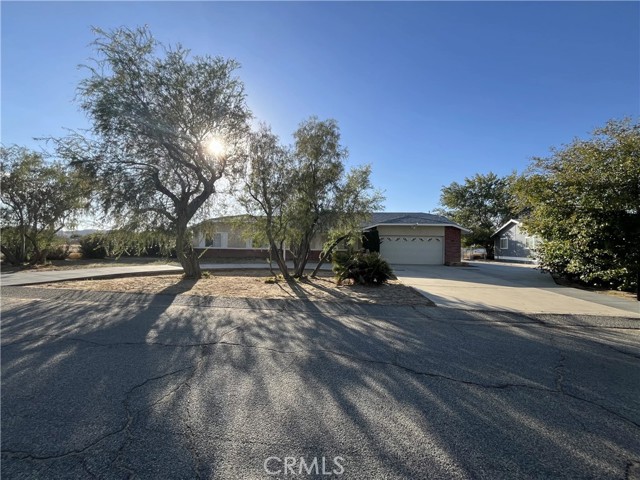
1 / 3
41059 176th Street East, Lancaster, CA 93535
$430K3bd · 2ba · 1,820 sqft
Lot 30,611 sqft•Single Family Residence•Active•10d on market•MLS# SR-26226786
41059 176th Street East, Lancaster, CA 93535
MLS# SR-26226786•Residential•Single Family Residence
Active10 days on market
$429,900
3
Beds
2
Baths
1,820
Sq Ft
30,611
Lot Sq Ft
1990
Year Built
Neighborhood
View
Property Description
Beautifully updated property in East Lancaster. All new interior paint, new flooring, new kitchen appliances, ground mounted solar system that will be paid off through the sale, fully fenced, has pull through access from two streets, newer roof and newer AC. This house is a MUST see!
Features & Amenities
FeeBuilt 1990
Property Details
Land Type
Fee
Year Built
1990
Property Type
Residential
Property Subtype
Single Family Residence
Heating
Central
Cooling
Central Air, None
View
Neighborhood
Roof
Composition
City
Lancaster
Zip Code
93535
County
Los Angeles
Mortgage Calculator
Current Rates
$
$
%
Monthly Payment
$2,173.81
Principal & Interest
Loan Amount
$343,920
Total Interest
$438,651
Total Payment Over 30 Years
$782,571
This calculator provides estimates only. Actual mortgage payments may include taxes, insurance, HOA fees, and PMI. Contact a lender for accurate quotes.
Comparative Market Analysis
Affordable Tier · 5 active · 5 closed
41059 176th Street East, Lancaster, CA 93535
Lancaster · Single Family Residence
$430K
Affordable TierBeds
3
Baths
2
Sqft
1,820
Lot
30,611 sqft
Year
1990
$/Sqft
$236
Pool: No✓
View: Neighborhood✓
Listed 7.5% above the median closed sale of $400,000. Price per sqft ($236) is a 24% discount to closed comps ($310). Closed comps sold at 104% of list — strong seller's market.
Price Position
Positioned above the market — commands a premium.
Premium
Subject listed at $430K· $236/sqft
Total list price
Closed comps
vs closed median $400K
+$30K (+7.5%)
Active comps
vs active median $425K
+$5K (+1.2%)
Price per sqft
Closed compsinsufficient comp data
Active comps
vs active avg $/sqft $283
−$47 (−16.7%)
Active Properties (5)
Active Comparables
| Address | City | Year | BD | BTH | SqFt | LotSz | LP/SqFt | LP | DIM | Score |
|---|---|---|---|---|---|---|---|---|---|---|
| 40912 169th | Lancaster | 1988 | 3 | 2 | 1,526 | 29,398 | $279 | $425,000 | 89 | 85 |
| 40629 174th | Lancaster | 1985 | 3 | 2 | 1,398 | 29,278 | $293 | $409,777 | 61 | 85 |
| 17247 Mossdale | Lancaster | 1979 | 4 | 2 | 1,384 | 31,053 | $289 | $399,900 | 33 | 83 |
| 16605 Valeport Avenue | Lancaster | 1984 | 3 | 2 | 1,402 | 29,920 | $321 | $449,900 | 12 | 83 |
| 16622 Mossdale | Lancaster | 1985 | 3 | 2 | 1,884 | 31,867 | $234 | $440,000 | 339 | 82 |
| Total: 5 · Average | 3.2 | 2.0 | 1,518.8 | 30,303.2 | $283.2 | $424,915.4 | 106.8 | |||
| Median | 1,402 | $425,000 | ||||||||
Closed Properties (5)
Closed Comparables
| Address | City | Year | Date | BD | BTH | SqFt | LotSz | LP | SP | SP/SqFt | SP/LP | DIM | Score |
|---|---|---|---|---|---|---|---|---|---|---|---|---|---|
| 40985 174th | Lancaster | 1987 | 05/20/2026 | 3 | 2 | 1,320 | 29,621 | $374,874 | $385,000 | $292 | 1.03 | 97 | 86 |
| 41104 171st | Lancaster | 1987 | 07/15/2026 | 3 | 2 | 1,305 | 29,427 | $395,000 | $415,000 | $318 | 1.05 | 61 | 84 |
| 41052 177th | Lancaster | 1979 | 09/28/2026 | 3 | 2 | 1,176 | 29,462 | $409,900 | $409,900 | $349 | 1.00 | 150 | 84 |
| 41038 171st | Lancaster | 1986 | 06/17/2026 | 3 | 2 | 1,320 | 29,408 | $395,000 | $400,000 | $303 | 1.01 | 75 | 84 |
| 40991 179th | Lancaster | 1979 | 08/31/2026 | 4 | 2 | 1,384 | 30,201 | $359,000 | $400,000 | $289 | 1.11 | 94 | 82 |
| Total: 5 · Average | 3.2 | 2.0 | 1,301 | 29,623.8 | $401,980 | $401,980 | $310.2 | — | 95.4 | ||||
| Median | 1,320 | $400,000 | $400,000 | ||||||||||
Market Analysis
List vs Sale $/SqFt
Sale Price Trend
Days on Market
Sale vs List Price
AI-generated CMA
This analysis was generated automatically from MLS data. For an in-depth, human-reviewed valuation, contact Joseph Sardella at josephsardella@gmail.com.