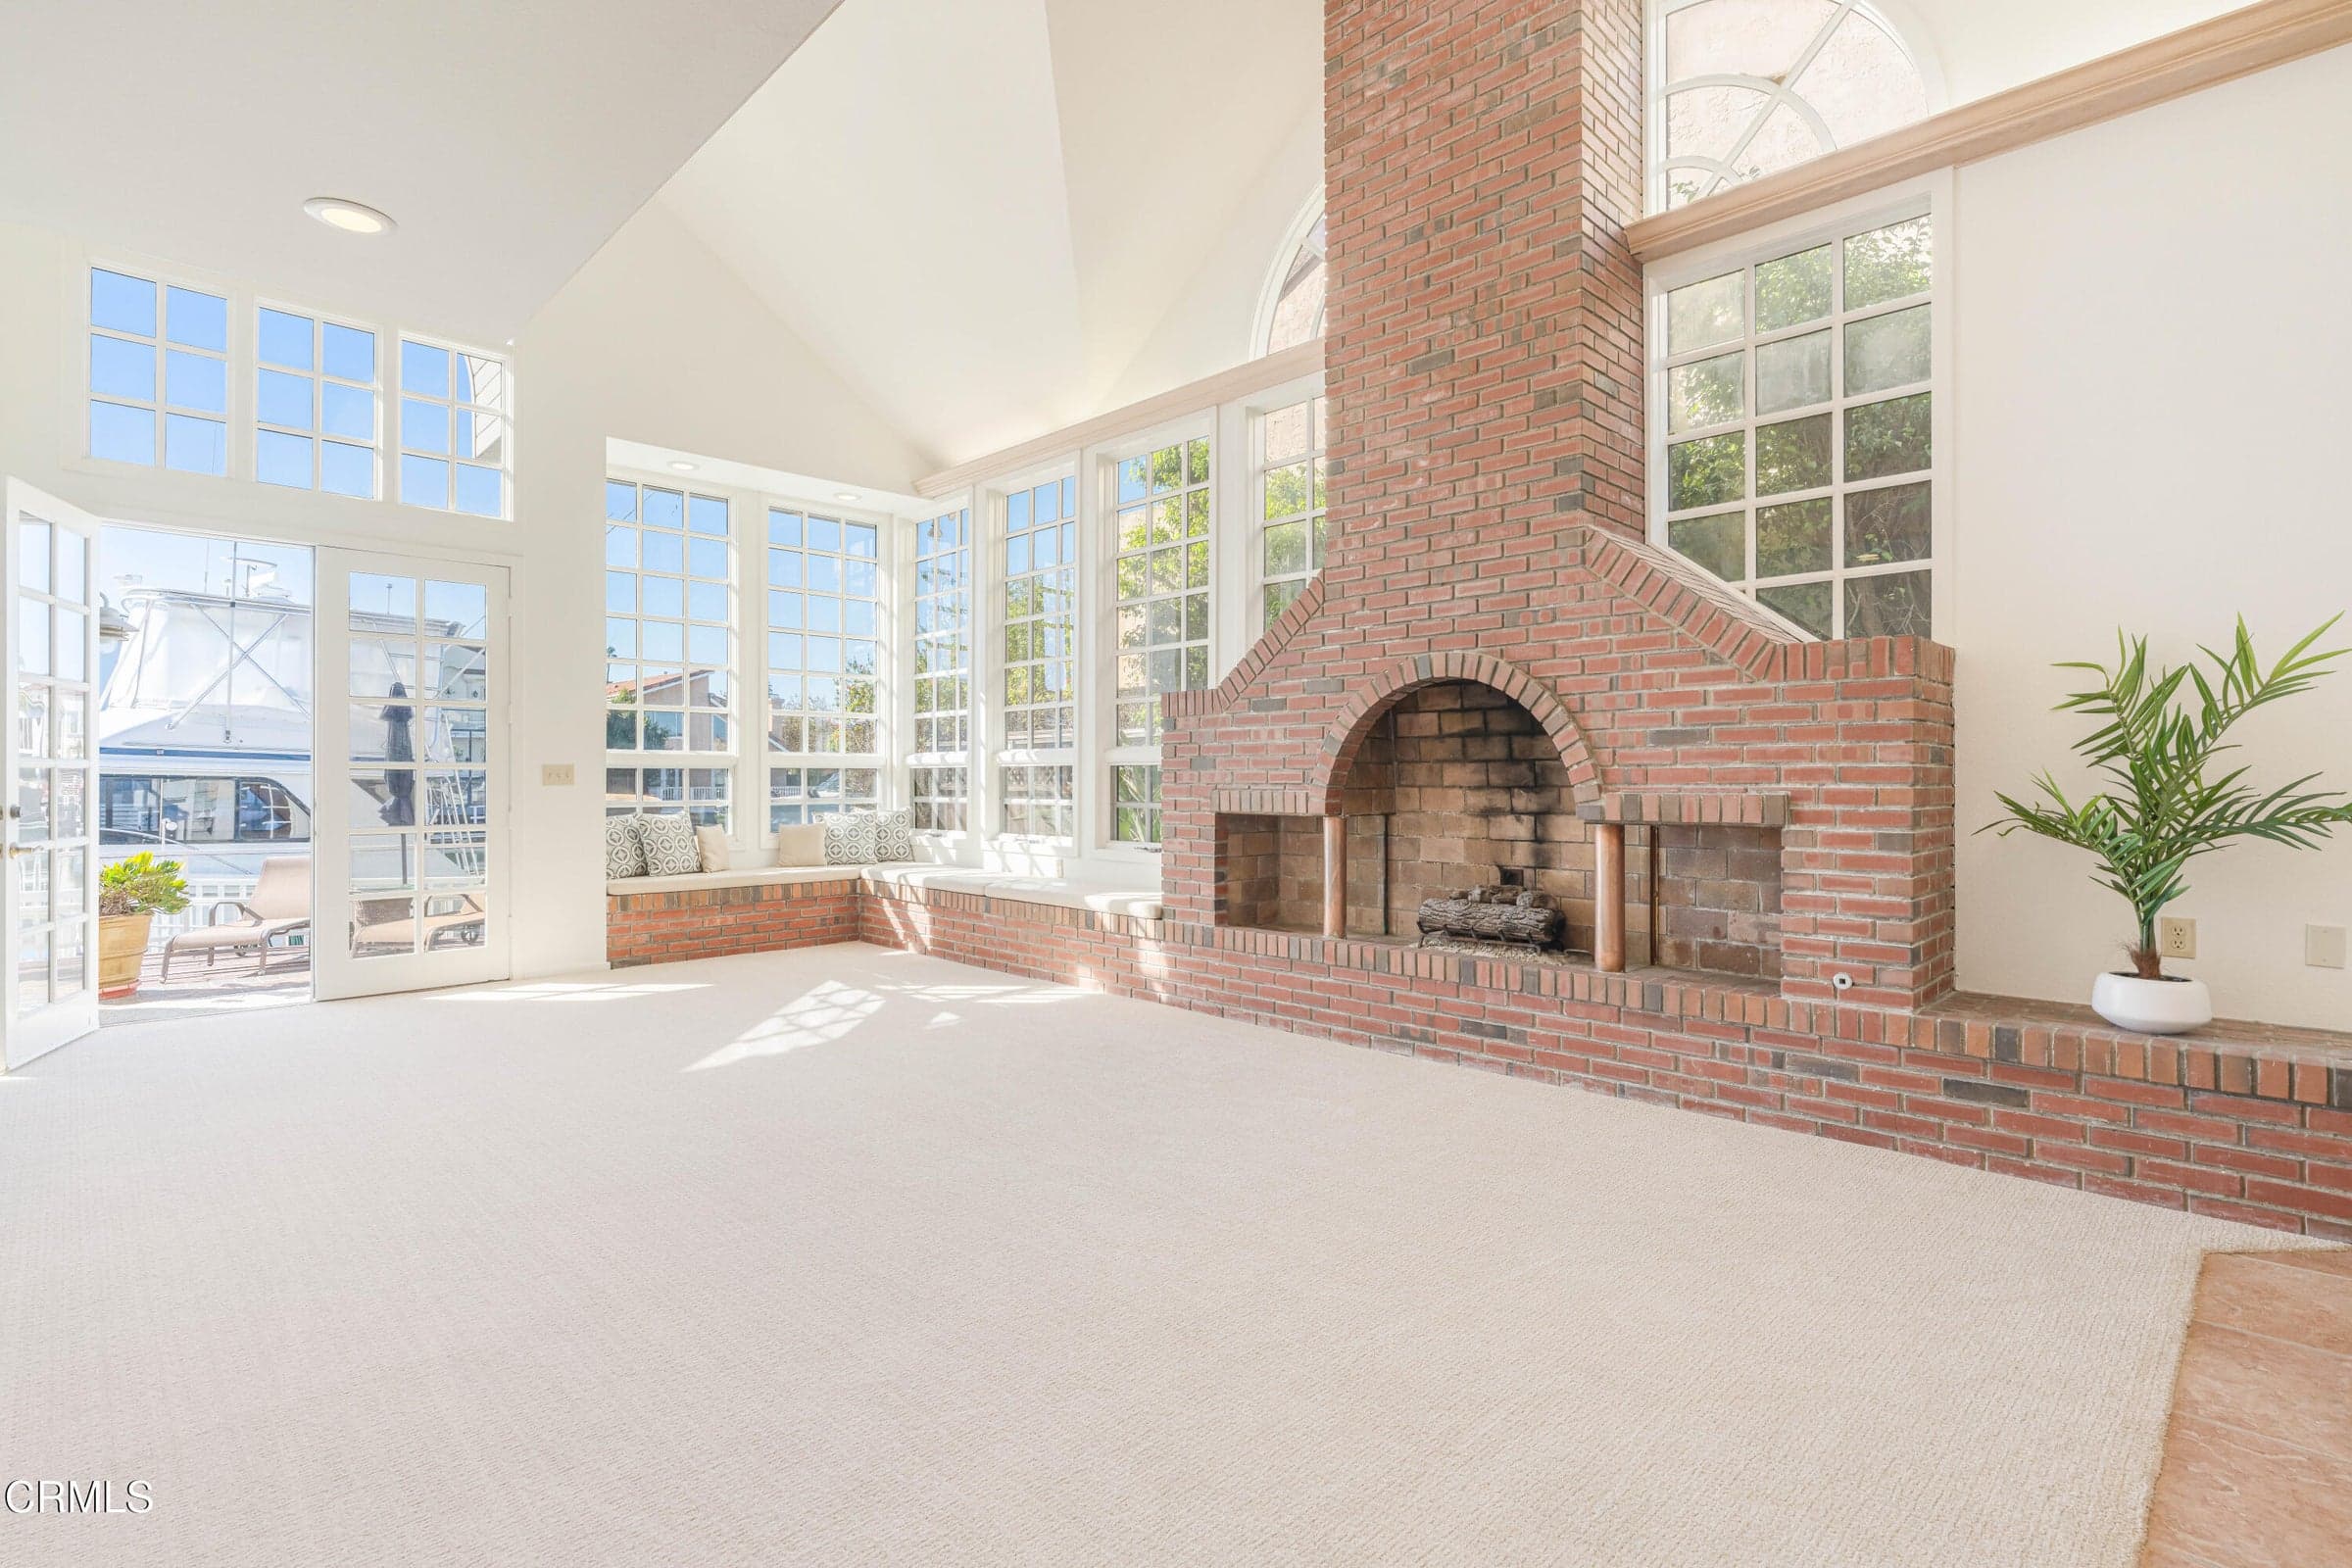
4030 Ischia Drive, Oxnard, CA 93035
4030 Ischia Drive, Oxnard, CA 93035
Property Description
One-of-a-kind, uniquely special home with a New England/Cape Cod vibe that exudes timeless charm! From the turreted entry to the walls of classic divided-light windows and spectacular brick fireplace - this is a house to be loved!! Located on a quiet cul- de-sac in Oxnard's Channel Islands Harbor with a private 40' boat dock easement in back and rare SOUTHERN deck exposure. Plenty of room to easily dock your boat and enjoy indoor/outdoor living with water views. Walking distance to Hollywood Beach with the Sunday Farmer's Market, Maritime Museum, yacht clubs and numerous restaurants and fun things to do!
Features & Amenities
Property Details
Mortgage Calculator
Current Rates
About Mandalay Bay 2 - 190402
This property is located in Mandalay Bay 2 - 190402, a community in Oxnard. Explore more listings in this neighborhood to compare options and pricing.
View Mandalay Bay 2 - 190402 ListingsComparative Market Analysis
Luxury Tier · 5 active · 5 closed
Mandalay Bay 2 - 190402 · Oxnard · Single Family Residence
Listed 3.3% below the median closed sale of $2,250,000. Price per sqft ($897) is a 14% premium to closed comps ($790). Closed comps sold at 94% of list — buyers have negotiating leverage. Luxury tier — fewer comparable sales widen the confidence range.
Price Position
Aligned with the market — fair pricing for the comps.
Active Properties (5)
Active Comparables
| Address | City | Year | BD | BTH | SqFt | LotSz | LP/SqFt | LP | DIM | Score |
|---|---|---|---|---|---|---|---|---|---|---|
| 2431 Victoria Avenue | Oxnard | 1973 | 3 | 3 | 1,987 | 3,920 | $979 | $1.95M | 95 | 74 |
| 2350 Monaco Drive | Oxnard | 1973 | 2 | 3 | 1,906 | 4,356 | $996 | $1.90M | 131 | 71 |
| 2025 Victoria Avenue | Oxnard | 1978 | 4 | 3 | 2,425 | 4,000 | $886 | $2.15M | 38 | 62 |
| 2355 Peninsula | Oxnard | 1978 | 3 | 3 | 2,104 | 4,356 | $998 | $2.10M | 62 | 61 |
| 2000 Peninsula Road | Oxnard | 1988 | 4 | 3 | 3,711 | 4,356 | $620 | $2.30M | 225 | 57 |
| Total: 5 · Average | 3.2 | 3.0 | 2,426.6 | 4,197.6 | $895.8 | $2.08M | 110.2 | |||
| Median | 2,104 | $2.10M | ||||||||
Closed Properties (5)
Closed Comparables
| Address | City | Year | Date | BD | BTH | SqFt | LotSz | LP | SP | SP/SqFt | SP/LP | DIM | Score |
|---|---|---|---|---|---|---|---|---|---|---|---|---|---|
| 3960 Hemlock Street | Oxnard | 1978 | 09/10/2026 | 4 | 3 | 2,700 | 4,000 | $2.25M | $2.00M | $741 | 0.89 | 69 | 73 |
| 1520 Viewpoint Drive | Oxnard | 2004 | 06/23/2026 | 4 | 3 | 3,131 | 4,080 | $2.65M | $2.40M | $767 | 0.91 | 96 | 67 |
| 4010 Romany Drive | Oxnard | 1978 | 08/05/2026 | 4 | 3 | 2,776 | 5,227 | $2.45M | $2.35M | $847 | 0.96 | 47 | 61 |
| 1517 Seabridge Lane | Oxnard | 2006 | 02/23/2026 | 4 | 3 | 3,096 | 5,997 | $1.89M | $1.89M | $609 | 1.00 | 38 | 60 |
| 104 La Brea Street | Oxnard | 2016 | 08/19/2026 | 3 | 4 | 2,280 | 1,750 | $2.40M | $2.25M | $987 | 0.94 | 176 | 60 |
| Total: 5 · Average | 3.8 | 3.2 | 2,796.6 | 4,210.8 | $2.18M | $2.18M | $790.2 | — | 85.2 | ||||
| Median | 2,776 | $2.25M | $2.25M | ||||||||||
Market Analysis
List vs Sale $/SqFt
Sale Price Trend
Days on Market
Sale vs List Price
This analysis was generated automatically from MLS data. For an in-depth, human-reviewed valuation, contact Joseph Sardella at josephsardella@gmail.com.