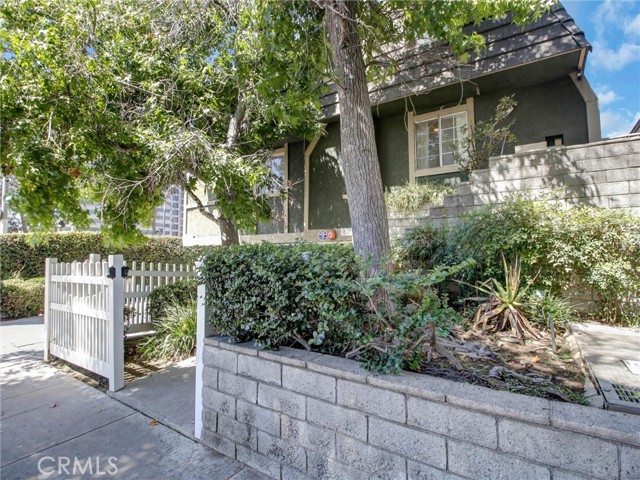
379 North Mentor Avenue, 1, Pasadena, CA 91106
379 North Mentor Avenue, 1, Pasadena, CA 91106
Property Description
Desirable Pasadena location. Fantastic tri-level two bedroom & two and half bath townhome in a small development of only 8 units. Minutes to old town Pasadena, Metro Gold Line station, shopping area, freeway and entertainment. Pasadena living at it's best. This unit has a spacious balcony, an ample living room, laundry inside the garage, a great kitchen and Dual Masters. Must see.
Features & Amenities
Property Details
Mortgage Calculator
Current Rates
Comparative Market Analysis
Affordable Tier · 5 active · 5 closed
Pasadena · Townhouse
Listed 3.1% above the median closed sale of $765,000. Price per sqft ($686) is a 14% premium to closed comps ($604).
Price Position
Aligned with the market — fair pricing for the comps.
Active Properties (5)
Active Comparables
| Address | City | Year | BD | BTH | SqFt | LotSz | LP/SqFt | LP | DIM | Score |
|---|---|---|---|---|---|---|---|---|---|---|
| 262 Wilson Avenue | Pasadena | 2022 | 2 | 3 | 1,230 | 8,240 | $722 | $888,000 | 30 | 87 |
| 1310 Orange Grove Boulevard | Pasadena | 1982 | 2 | 3 | 1,339 | 59,242 | $571 | $765,000 | 6 | 86 |
| 201 Catalina | Pasadena | 1979 | 3 | 3 | 1,268 | 31,088 | $670 | $849,000 | 6 | 82 |
| 501 Del Mar Boulevard | Pasadena | 1987 | 2 | 2 | 1,231 | 36,789 | $568 | $699,000 | 50 | 81 |
| 431 Los Robles Avenue | Pasadena | 2009 | 2 | 3 | 1,230 | 21,772 | $601 | $739,000 | 116 | 79 |
| Total: 5 · Average | 2.2 | 2.8 | 1,259.6 | 31,426.2 | $626.4 | $788,000 | 41.6 | |||
| Median | 1,231 | $765,000 | ||||||||
Closed Properties (5)
Closed Comparables
| Address | City | Year | Date | BD | BTH | SqFt | LotSz | LP | SP | SP/SqFt | SP/LP | DIM | Score |
|---|---|---|---|---|---|---|---|---|---|---|---|---|---|
| 99 Catalina Avenue | Pasadena | 1982 | 11/13/2025 | 2 | 3 | 1,164 | 10,858 | $749,000 | $740,000 | $636 | 0.99 | 35 | 91 |
| 1310 Orange Grove Boulevard | Pasadena | 1982 | 10/22/2026 | 2 | 3 | 1,339 | 59,194 | $775,000 | $765,000 | $571 | 0.99 | 64 | 87 |
| 823 Earlham Street | Pasadena | 1988 | 04/14/2026 | 2 | 3 | 1,203 | 23,516 | $799,000 | $770,000 | $640 | 0.96 | 49 | 87 |
| 1348 Orange Grove Boulevard | Pasadena | 1980 | 05/12/2026 | 2 | 2 | 1,120 | 13,985 | $699,000 | $709,000 | $633 | 1.01 | 61 | 86 |
| 1484 Corson Street | Pasadena | 1980 | 10/09/2026 | 2 | 3 | 1,450 | 41,724 | $765,888 | $785,000 | $541 | 1.02 | 38 | 83 |
| Total: 5 · Average | 2.0 | 2.8 | 1,255.2 | 29,855.4 | $753,800 | $753,800 | $604.2 | — | 49.4 | ||||
| Median | 1,203 | $765,000 | $765,000 | ||||||||||
Market Analysis
List vs Sale $/SqFt
Sale Price Trend
Days on Market
Sale vs List Price
This analysis was generated automatically from MLS data. For an in-depth, human-reviewed valuation, contact Joseph Sardella at josephsardella@gmail.com.