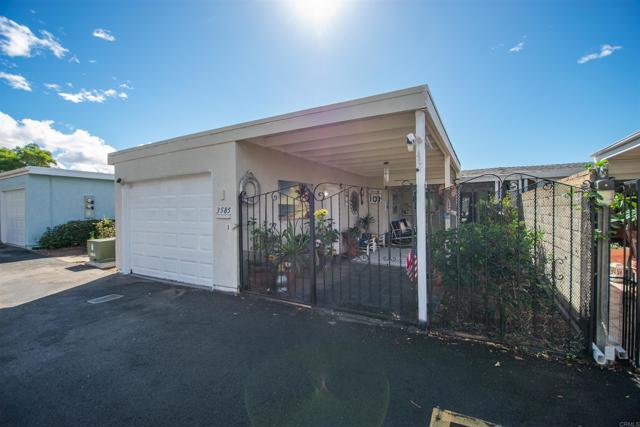
3585 Buffum Drive, Oceanside, CA 92057
3585 Buffum Drive, Oceanside, CA 92057
Property Description
Charming home with a spacious, open-concept floor plan. The kitchen, dining, and living areas flow together seamlessly, creating an ideal space for entertaining, as well as, beautifully functional for everyday living. Newer Stainless Steel Appliances add to the shaker-style cabinets in the kitchen. Large windows throughout the home flood the house with natural light while showcasing views of the landscaped common area. The kitchen slider leads to a large, private, Spanish-tiled patio with golf course views, an amazing benefit to this location in the community. Perfect for enjoying a morning cup of coffee or tea and the ocean breeze reminds you how close you are to Oceanside beaches, the harbor, dining, and golf. The neighborhood is well-maintained by the HOA. The Oceana South community offers resort-style amenities, but residents enjoy low HOA dues. It includes a clubhouse, heated swimming pool, and relaxing jacuzzi, landscaping, water, sewer, trash, and basic cable. The community also offers weekly activities for those who like to connect with their neighbors. There are some projects the home needs, but the low price allows you to make this house your home.
Features & Amenities
Property Details
Mortgage Calculator
Current Rates
Comparative Market Analysis
Affordable Tier · 4 active · 5 closed
Oceanside · Single Family Residence
Listed 4.0% below the median closed sale of $422,001.
Price Position
Aligned with the market — fair pricing for the comps.
Active Properties (4)
Active Comparables
| Address | City | Year | BD | BTH | SqFt | LotSz | LP/SqFt | LP | DIM | Score |
|---|---|---|---|---|---|---|---|---|---|---|
| 3613 BRANDYWINE | Oceanside | 1973 | 2 | 2 | 1,046 | 1,777 | $406 | $425,000 | 5 | 95 |
| 3631 Brandywine Street | Oceanside | 1975 | 2 | 2 | 1,050 | 0 | $393 | $412,500 | 27 | 94 |
| 3760 Vista Campana | Oceanside | 1967 | 2 | 2 | 994 | 1,307 | $432 | $429,900 | 55 | 87 |
| 3685 Vista Campana | Oceanside | 1965 | 2 | 2 | 1,232 | 1,473 | $283 | $349,000 | 139 | 83 |
| Total: 4 · Average | 2.0 | 2.0 | 1,080.5 | 1,519 | $378.5 | $404,100 | 56.5 | |||
| Median | 1,050 | $425,000 | ||||||||
Closed Properties (5)
Closed Comparables
| Address | City | Year | Date | BD | BTH | SqFt | LotSz | LP | SP | SP/SqFt | SP/LP | DIM | Score |
|---|---|---|---|---|---|---|---|---|---|---|---|---|---|
| 3599 Buffum Drive | Oceanside | 1974 | 07/10/2026 | 2 | 2 | 1,046 | 1,742 | $399,999 | $395,000 | $378 | 0.99 | 29 | 95 |
| 3599 Pear Blossom Drive | Oceanside | 1973 | 12/22/2025 | 2 | 2 | 1,046 | 1,809 | $399,990 | $389,000 | $372 | 0.97 | 28 | 88 |
| 3839 Vista Campana | Oceanside | 1970 | 06/18/2026 | 2 | 2 | 994 | 1,631 | $475,000 | $463,000 | $466 | 0.97 | 167 | 88 |
| 3676 Bartlett Ave. | Oceanside | 1975 | 11/04/2025 | 2 | 2 | 1,050 | 1,707 | $449,950 | $439,500 | $419 | 0.98 | 82 | 88 |
| 3760 Vista Campana S | Oceanside | 1967 | 10/22/2026 | 2 | 2 | 1,000 | 1,306 | $399,900 | $422,001 | $422 | 1.05 | 34 | 88 |
| Total: 5 · Average | 2.0 | 2.0 | 1,027.2 | 1,639 | $421,700.2 | $421,700.2 | $411.4 | — | 68 | ||||
| Median | 1,046 | $422,001 | $422,001 | ||||||||||
Market Analysis
List vs Sale $/SqFt
Sale Price Trend
Days on Market
Sale vs List Price
This analysis was generated automatically from MLS data. For an in-depth, human-reviewed valuation, contact Joseph Sardella at josephsardella@gmail.com.