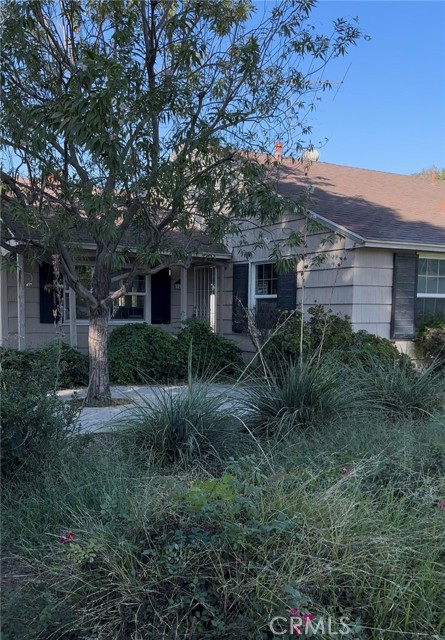
3457 Sunnyside Drive, Riverside, CA 92506
3457 Sunnyside Drive, Riverside, CA 92506
Property Description
Prime Investor Opportunity in Riverside’s Desirable Magnolia Center Neighborhood! Bring your vision and tools to 3457 Sunnyside Dr, Riverside, CA 92506. Set on a generous 7,840-square-foot lot in the highly sought-after 92506 zip code, this single-family fixer offers incredible potential for cash buyers, flippers, or portfolio builders looking for their next rewarding project. Built in 1953, the home features 1,414 square feet of interior living space with a functional layout consisting of 3 bedrooms, 2 bathrooms, and a detached garage. Highlights include a classic brick fireplace in the living space and central cooling, providing a solid foundation for a full modern transformation.
Features & Amenities
Property Details
Mortgage Calculator
Current Rates
Comparative Market Analysis
Affordable Tier · 5 active · 5 closed
Riverside · Single Family Residence
Listed 10.7% below the median closed sale of $560,000. Price per sqft ($354) is a 17% discount to closed comps ($424).
Price Position
Priced below the market — value advantage over the field.
Active Properties (5)
Active Comparables
| Address | City | Year | BD | BTH | SqFt | LotSz | LP/SqFt | LP | DIM | Score |
|---|---|---|---|---|---|---|---|---|---|---|
| 3469 Tipperary | Riverside | 1957 | 3 | 2 | 1,243 | 8,276 | $463 | $574,990 | 14 | 94 |
| 6080 LAWSON Way | Riverside | 1949 | 3 | 2 | 1,345 | 5,227 | $416 | $559,900 | 75 | 90 |
| 6730 Montclair Dr | Riverside | 1956 | 3 | 2 | 1,264 | 7,841 | $435 | $550,000 | 18 | 84 |
| 4909 Luther Street | Riverside | 1950 | 3 | 2 | 1,117 | 6,970 | $470 | $525,000 | 28 | 80 |
| 3620 Nelson | Riverside | 1951 | 2 | 1 | 824 | 6,970 | $666 | $549,000 | 2 | 78 |
| Total: 5 · Average | 2.8 | 1.8 | 1,158.6 | 7,056.8 | $490 | $551,778 | 27.4 | |||
| Median | 1,243 | $550,000 | ||||||||
Closed Properties (5)
Closed Comparables
| Address | City | Year | Date | BD | BTH | SqFt | LotSz | LP | SP | SP/SqFt | SP/LP | DIM | Score |
|---|---|---|---|---|---|---|---|---|---|---|---|---|---|
| 6050 Colonial | Riverside | 1951 | 10/21/2026 | 3 | 2 | 1,126 | 6,970 | $580,000 | $565,000 | $502 | 0.97 | 90 | 90 |
| 6041 Hamilton | Riverside | 1951 | 07/03/2026 | 3 | 2 | 1,303 | 6,970 | $569,000 | $575,000 | $441 | 1.01 | 52 | 87 |
| 5247 Monterey | Riverside | 1954 | 12/16/2025 | 3 | 2 | 1,118 | 8,276 | $450,000 | $430,000 | $385 | 0.96 | 36 | 84 |
| 6064 Riverside | Riverside | 1960 | 11/24/2025 | 3 | 2 | 1,506 | 6,969 | $559,999 | $560,000 | $372 | 1.00 | 46 | 83 |
| 5680 Osburn | Riverside | 1926 | 07/02/2026 | 2 | 1 | 1,224 | 4,792 | $499,000 | $515,000 | $421 | 1.03 | 80 | 77 |
| Total: 5 · Average | 2.8 | 1.8 | 1,255.4 | 6,795.4 | $529,000 | $529,000 | $424.2 | — | 60.8 | ||||
| Median | 1,224 | $560,000 | $560,000 | ||||||||||
Market Analysis
List vs Sale $/SqFt
Sale Price Trend
Days on Market
Sale vs List Price
This analysis was generated automatically from MLS data. For an in-depth, human-reviewed valuation, contact Joseph Sardella at josephsardella@gmail.com.