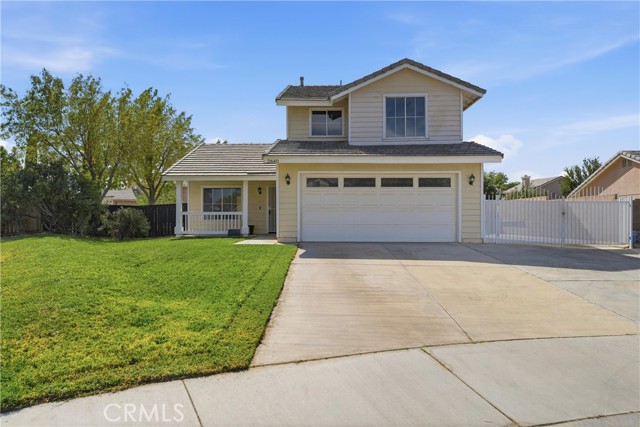
2640 Minford Court, Lancaster, CA 93536
2640 Minford Court, Lancaster, CA 93536
Property Description
Welcome Home! This move-in-ready beauty has been freshly updated with new interior paint and flooring throughout! Step inside to discover soaring ceilings, spacious rooms, and two separate living areas, offering plenty of room to relax and entertain. The generously sized primary suite features high ceilings and a walk-in closet. Outside, you'll find an expansive backyard with endless possibilities, perfect for entertaining, outdoor activities, or creating your dream outdoor retreat. The oversized lot also offers generous RV parking, a fantastic feature for those needing extra space for recreational vehicles or toys! Additional highlights include a metal garage door and a functional floor plan with comfortable living spaces throughout. Fresh updates, spacious living, and an impressive lot make this home a must-see! Schedule your private showing today!
Features & Amenities
Property Details
Mortgage Calculator
Current Rates
Comparative Market Analysis
Affordable Tier · 5 active · 5 closed
Lancaster · Single Family Residence
Listed in line with the median closed sale of $479,990. Closed comps sold at 101% of list — strong seller's market.
Price Position
Aligned with the market — fair pricing for the comps.
Active Properties (5)
Active Comparables
| Address | City | Year | BD | BTH | SqFt | LotSz | LP/SqFt | LP | DIM | Score |
|---|---|---|---|---|---|---|---|---|---|---|
| 2644 Newgrove Street | Lancaster | 1993 | 3 | 3 | 1,294 | 7,468 | $402 | $519,990 | 13 | 95 |
| 2614 Newgrove Street | Lancaster | 1993 | 3 | 3 | 1,294 | 6,645 | $379 | $489,900 | 5 | 95 |
| 44236 27th | Lancaster | 1989 | 3 | 2 | 1,485 | 7,152 | $329 | $489,000 | 70 | 83 |
| 2564 Norberry Street | Lancaster | 1994 | 4 | 3 | 1,794 | 7,162 | $251 | $450,000 | 56 | 80 |
| 44328 Soft Avenue | Lancaster | 1988 | 4 | 2 | 1,815 | 7,941 | $270 | $490,000 | 16 | 75 |
| Total: 5 · Average | 3.4 | 2.6 | 1,536.4 | 7,273.6 | $326.2 | $487,778 | 32 | |||
| Median | 1,485 | $489,900 | ||||||||
Closed Properties (5)
Closed Comparables
| Address | City | Year | Date | BD | BTH | SqFt | LotSz | LP | SP | SP/SqFt | SP/LP | DIM | Score |
|---|---|---|---|---|---|---|---|---|---|---|---|---|---|
| 2634 Minford | Lancaster | 1993 | 04/07/2026 | 4 | 3 | 1,516 | 12,329 | $480,000 | $480,000 | $317 | 1.00 | 39 | 87 |
| 2812 Minford Street | Lancaster | 1994 | 07/22/2026 | 4 | 3 | 1,516 | 7,097 | $479,990 | $479,990 | $317 | 1.00 | 54 | 85 |
| 44719 Tarragon Drive | Lancaster | 1991 | 09/21/2026 | 3 | 2 | 1,045 | 6,822 | $440,000 | $450,000 | $431 | 1.02 | 38 | 85 |
| 2608 Oldfield Street | Lancaster | 1993 | 11/26/2025 | 3 | 3 | 1,689 | 7,805 | $499,990 | $494,990 | $293 | 0.99 | 55 | 81 |
| 2827 Milling | Lancaster | 1996 | 05/29/2026 | 2 | 2 | 932 | 6,604 | $400,000 | $417,000 | $447 | 1.04 | 36 | 77 |
| Total: 5 · Average | 3.2 | 2.6 | 1,339.6 | 8,131.4 | $464,396 | $464,396 | $361 | — | 44.4 | ||||
| Median | 1,516 | $479,990 | $479,990 | ||||||||||
Market Analysis
List vs Sale $/SqFt
Sale Price Trend
Days on Market
Sale vs List Price
This analysis was generated automatically from MLS data. For an in-depth, human-reviewed valuation, contact Joseph Sardella at josephsardella@gmail.com.