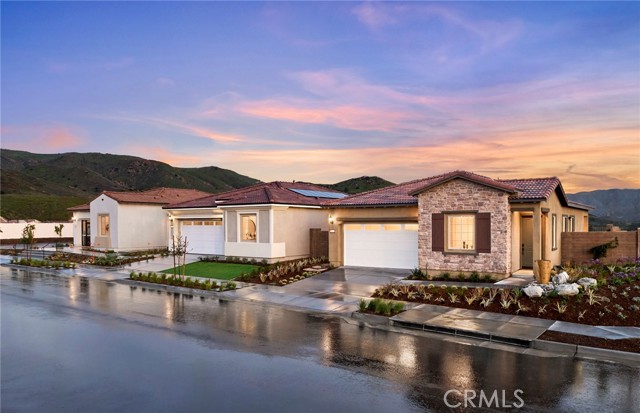
23688 Shoal Drive, Corona, CA 92883
23688 Shoal Drive, Corona, CA 92883
Property Description
Brand new Residence 1 floorplan in Terramor, a premier 55+ active adult community with amenities like pool, fitness, clubhouse, and trails. This home includes, upgraded countertops, luxury flooring, and a large island at the kitchen. -Open-concept floor plan -Upgraded Kitchen Countertops -Upgraded LVP -Upgraded Kitchenaid Appliances -10' ceilings -Upgraded lighting
Features & Amenities
Property Details
Mortgage Calculator
Current Rates
Comparative Market Analysis
Affordable Tier · 5 active · 5 closed
Corona · Single Family Residence
Listed in line with the median closed sale of $587,990. Expect a longer timeline — comps averaged 177 days on market.
Price Position
Aligned with the market — fair pricing for the comps.
Active Properties (5)
Active Comparables
| Address | City | Year | BD | BTH | SqFt | LotSz | LP/SqFt | LP | DIM | Score |
|---|---|---|---|---|---|---|---|---|---|---|
| 23675 Shoal Drive | Corona | 2026 | 2 | 2 | 1,324 | 3,487 | $439 | $581,780 | 62 | 99 |
| 11973 Hillsong Drive | Corona | 2026 | 2 | 2 | 1,375 | 3,427 | $385 | $529,990 | 29 | 98 |
| 11890 Coulter Drive | Corona | 2026 | 2 | 2 | 1,366 | 3,643 | $455 | $620,990 | 62 | 98 |
| 23676 Shoal Drive | Corona | 2026 | 2 | 2 | 1,366 | 3,619 | $443 | $604,990 | 162 | 96 |
| 23793 Highvale | Corona | 2023 | 2 | 2 | 1,374 | 4,356 | $422 | $580,000 | 18 | 96 |
| Total: 5 · Average | 2.0 | 2.0 | 1,361 | 3,706.4 | $428.8 | $583,550 | 66.6 | |||
| Median | 1,366 | $581,780 | ||||||||
Closed Properties (5)
Closed Comparables
| Address | City | Year | Date | BD | BTH | SqFt | LotSz | LP | SP | SP/SqFt | SP/LP | DIM | Score |
|---|---|---|---|---|---|---|---|---|---|---|---|---|---|
| 23686 Highvale Drive | Corona | 2025 | 09/16/2026 | 2 | 2 | 1,324 | 3,484 | $549,990 | $536,990 | $406 | 0.98 | 336 | 99 |
| 23687 Shoal Drive | Corona | 2026 | 09/14/2026 | 2 | 2 | 1,375 | 3,619 | $597,990 | $580,990 | $423 | 0.97 | 118 | 98 |
| 11949 Hillsong Drive | Corona | 2026 | 06/26/2026 | 2 | 2 | 1,324 | 3,619 | $588,285 | $587,990 | $444 | 1.00 | 66 | 97 |
| 11894 Greenpeak | Corona | 2023 | 07/31/2026 | 2 | 2 | 1,326 | 4,356 | $589,888 | $589,888 | $445 | 1.00 | 198 | 96 |
| 23674 Highvale Drive | Corona | 2025 | 04/02/2026 | 2 | 2 | 1,366 | 3,481 | $633,628 | $598,990 | $438 | 0.94 | 169 | 95 |
| Total: 5 · Average | 2.0 | 2.0 | 1,343 | 3,711.8 | $578,969.6 | $578,969.6 | $431.2 | — | 177.4 | ||||
| Median | 1,326 | $587,990 | $587,990 | ||||||||||
Market Analysis
List vs Sale $/SqFt
Sale Price Trend
Days on Market
Sale vs List Price
This analysis was generated automatically from MLS data. For an in-depth, human-reviewed valuation, contact Joseph Sardella at josephsardella@gmail.com.