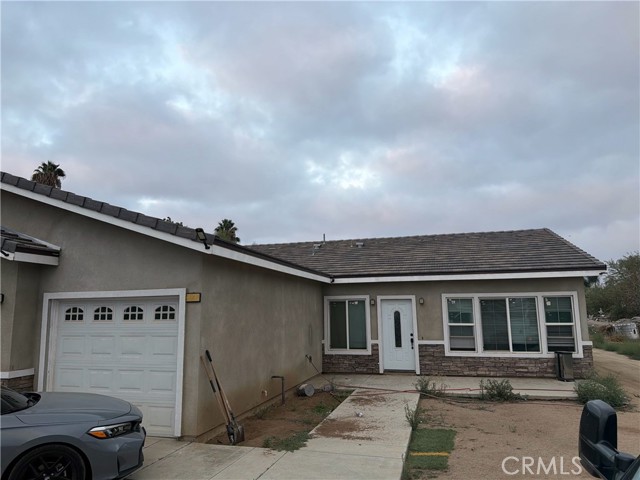
20713 Clark Street, Perris, CA 92570
20713 Clark Street, Perris, CA 92570
Property Description
** Beautiful Single Story Home on a HUGE LOT with over 1 Acre of Land ** This home has 4 Bedrooms, 2 Baths and a 3 Car Attached Garage ** Situated on a paved road ** Elegant laminate floors with neutral colors ** Nice touches to the formal dining area with decor pillars and built-in niche in the living room ** Spacious kitchen with center island, drop lighting, white cabinets and barn sink ** Near Schools and Community Center ** Lots of extras, come and take a look **
Features & Amenities
Property Details
Mortgage Calculator
Current Rates
Comparative Market Analysis
Residential Tier · 3 active · 5 closed
Perris · Single Family Residence
Listed in line with the median closed sale of $670,000. Price per sqft ($320) is a 20% discount to closed comps ($400). Closed comps sold at 101% of list — strong seller's market.
Price Position
Aligned with the market — fair pricing for the comps.
Active Properties (3)
Active Comparables
| Address | City | Year | BD | BTH | SqFt | LotSz | LP/SqFt | LP | DIM | Score |
|---|---|---|---|---|---|---|---|---|---|---|
| 21688 Bailly | Perris | 2020 | 4 | 2 | 2,078 | 19,166 | $313 | $650,000 | 11 | 64 |
| 22200 Alviso | Perris | 1960 | 3 | 3 | 2,462 | 115,870 | $268 | $659,900 | 34 | 61 |
| 20895 Perry Street | Perris | 1993 | 3 | 2 | 1,253 | 38,768 | $478 | $599,000 | 9 | 59 |
| Total: 3 · Average | 3.3 | 2.3 | 1,931 | 57,934.667 | $353 | $636,300 | 18 | |||
| Median | 2,078 | $650,000 | ||||||||
Closed Properties (5)
Closed Comparables
| Address | City | Year | Date | BD | BTH | SqFt | LotSz | LP | SP | SP/SqFt | SP/LP | DIM | Score |
|---|---|---|---|---|---|---|---|---|---|---|---|---|---|
| 20541 Hunter | Perris | 2026 | 10/19/2026 | 4 | 3 | 2,116 | 19,166 | $760,000 | $740,000 | $350 | 0.97 | 216 | 73 |
| 21210 Rider Street | Perris | 1960 | 10/13/2026 | 4 | 2 | 1,516 | 43,560 | $549,000 | $580,000 | $383 | 1.06 | 71 | 72 |
| 21769 High | Perris | 1986 | 07/24/2026 | 3 | 2 | 1,218 | 39,640 | $555,000 | $555,000 | $456 | 1.00 | 39 | 71 |
| 20561 Hunter | Perris | 2025 | 11/26/2025 | 4 | 3 | 2,166 | 19,166 | $739,900 | $739,900 | $342 | 1.00 | 138 | 69 |
| 21470 Old Elsinore Road | Perris | 1965 | 08/03/2026 | 4 | 2 | 1,436 | 87,120 | $647,770 | $670,000 | $467 | 1.03 | 59 | 68 |
| Total: 5 · Average | 3.8 | 2.4 | 1,690.4 | 41,730.4 | $656,980 | $656,980 | $399.6 | — | 104.6 | ||||
| Median | 1,516 | $670,000 | $670,000 | ||||||||||
Market Analysis
List vs Sale $/SqFt
Sale Price Trend
Days on Market
Sale vs List Price
This analysis was generated automatically from MLS data. For an in-depth, human-reviewed valuation, contact Joseph Sardella at josephsardella@gmail.com.