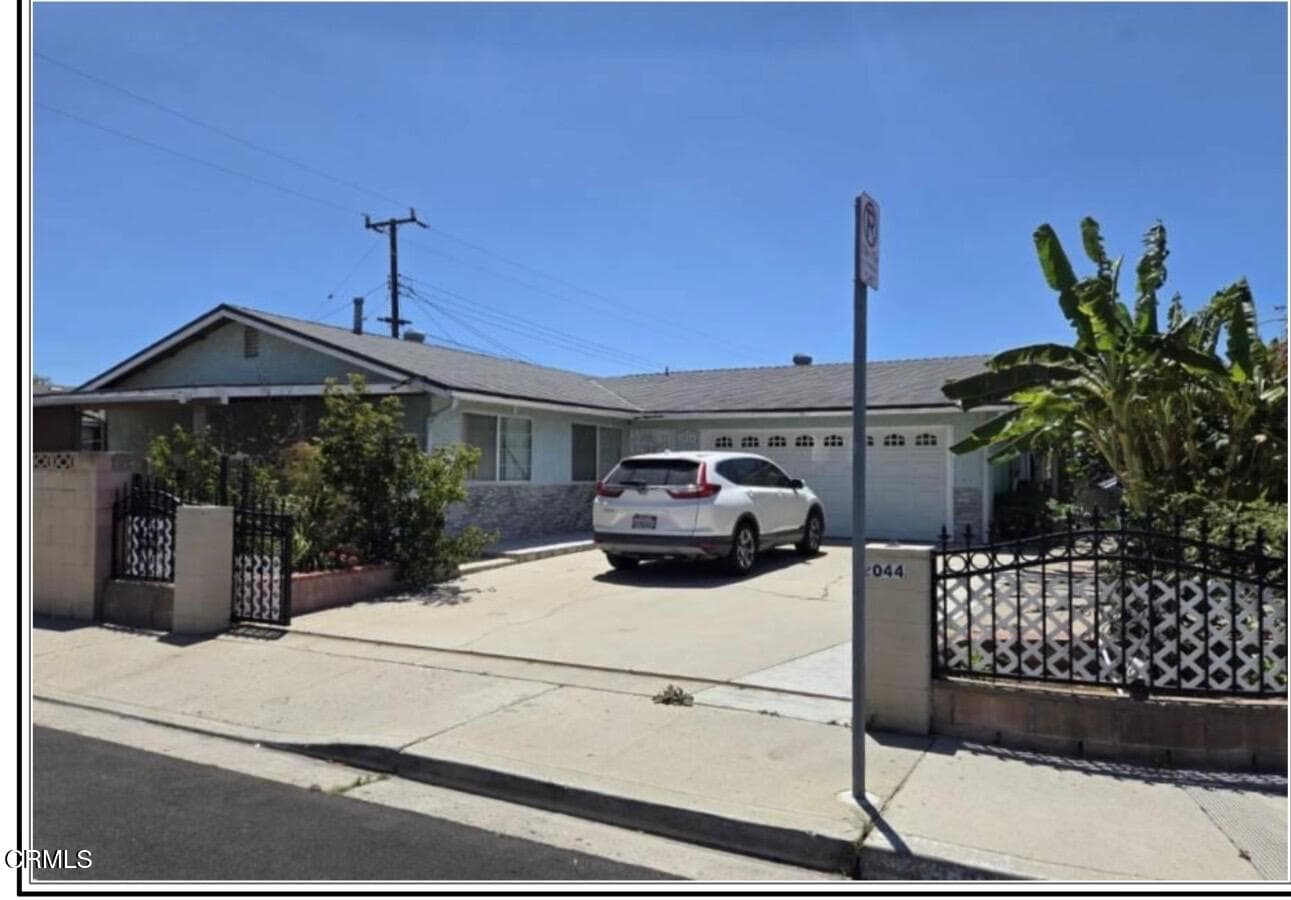
2044 San Jose Street, Oxnard, CA 93030
2044 San Jose Street, Oxnard, CA 93030
Property Description
Priced for a quick sale at $699,900--one of the lowest-priced single-family homes in the area! Charming single-story home on a corner lot of over 4,000 sq ft in Oxnard's Rose Park neighborhood. Featuring 3 bedrooms, 1 bathroom per public records, and approximately 1,023 sq ft of recorded living space, this home offers tile floors throughout, an upgraded kitchen, and an updated bathroom. The converted garage offers bonus space, including a game room and two additional bathrooms. The additions and garage conversion were completed without permits. Buyer to independently verify square footage, permits, and allowable uses. No HOA and conveniently located near shopping, parks, and schools. Come see the possibilities!
Features & Amenities
Property Details
Mortgage Calculator
Current Rates
About Rose Park 1 - 136301
This property is located in Rose Park 1 - 136301, a community in Oxnard. Explore more listings in this neighborhood to compare options and pricing.
View Rose Park 1 - 136301 ListingsComparative Market Analysis
Affordable Tier · 5 active · 5 closed
Rose Park 1 - 136301 · Oxnard · Single Family Residence
Listed in line with the median closed sale of $718,000.
Price Position
Aligned with the market — fair pricing for the comps.
Active Properties (5)
Active Comparables
| Address | City | Year | BD | BTH | SqFt | LotSz | LP/SqFt | LP | DIM | Score |
|---|---|---|---|---|---|---|---|---|---|---|
| 1440 Morris Street | Oxnard | 1964 | 4 | 1 | 1,080 | 3,920 | $694 | $750,000 | 160 | 78 |
| 210 Harding Avenue | Oxnard | 1950 | 3 | 1 | 1,071 | 3,920 | $613 | $657,000 | 101 | 75 |
| 743 Paseo Ortega | Oxnard | 2000 | 3 | 2 | 1,255 | 2,613 | $594 | $745,000 | 12 | 71 |
| 1018 C Street | Oxnard | 1943 | 2 | 1 | 704 | 6,969 | $923 | $649,900 | 109 | 57 |
| 330 Devonshire Drive | Oxnard | 1970 | 3 | 3 | 1,499 | 6,098 | $510 | $765,000 | 36 | 56 |
| Total: 5 · Average | 3.0 | 1.6 | 1,121.8 | 4,704 | $666.8 | $713,380 | 83.6 | |||
| Median | 1,080 | $745,000 | ||||||||
Closed Properties (5)
Closed Comparables
| Address | City | Year | Date | BD | BTH | SqFt | LotSz | LP | SP | SP/SqFt | SP/LP | DIM | Score |
|---|---|---|---|---|---|---|---|---|---|---|---|---|---|
| 2005 San Jose Street | Oxnard | 1963 | 08/28/2026 | 3 | 1 | 1,023 | 3,920 | $698,900 | $710,000 | $694 | 1.02 | 34 | 98 |
| 2020 San Jose Street | Oxnard | 1963 | 07/14/2026 | 3 | 1 | 1,023 | 4,356 | $724,999 | $718,000 | $702 | 0.99 | 85 | 88 |
| 124 Driskill Street | Oxnard | 1962 | 11/04/2025 | 4 | 2 | 1,002 | 3,920 | $745,000 | $745,000 | $744 | 1.00 | 98 | 73 |
| 221 Vegas Drive | Oxnard | 1969 | 10/21/2026 | 4 | 2 | 1,260 | 4,791 | $699,000 | $710,000 | $563 | 1.02 | 41 | 70 |
| 619 Paseo Margarita | Oxnard | 2000 | 06/12/2026 | 3 | 3 | 1,358 | 2,457 | $749,900 | $735,000 | $541 | 0.98 | 28 | 65 |
| Total: 5 · Average | 3.4 | 1.8 | 1,133.2 | 3,888.8 | $723,600 | $723,600 | $648.8 | — | 57.2 | ||||
| Median | 1,023 | $718,000 | $718,000 | ||||||||||
Market Analysis
List vs Sale $/SqFt
Sale Price Trend
Days on Market
Sale vs List Price
This analysis was generated automatically from MLS data. For an in-depth, human-reviewed valuation, contact Joseph Sardella at josephsardella@gmail.com.