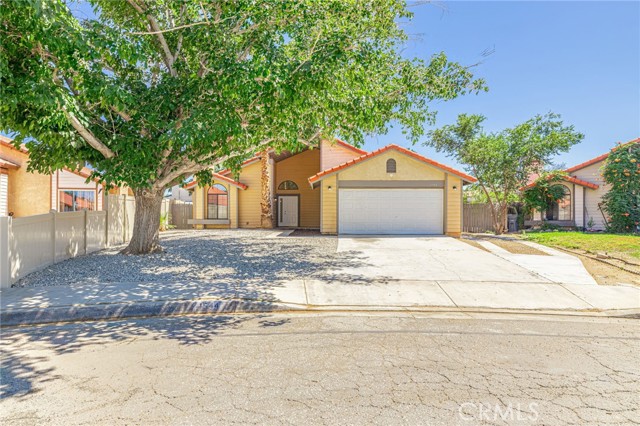
1544 East Norberry, Lancaster, CA 93535
1544 East Norberry, Lancaster, CA 93535
Property Description
Gorgeous single story home in East Lancaster with RV access and a large yard. This home features a spacious living room with a fireplace. There is a dining room connected to the kitchen and living room, perfect for entertaining. The kitchen features updated countertops, white cabinetry and stainless steel appliances. This home has 3 bedrooms and 2 bathrooms. There is a dedicated laundry room with access to the garage. The rear yard is oversized with RV access. This home is a MUST see!
Features & Amenities
Property Details
Mortgage Calculator
Current Rates
Comparative Market Analysis
Affordable Tier · 5 active · 5 closed
Lancaster · Single Family Residence
Listed in line with the median closed sale of $420,000. Closed comps sold at 102% of list — strong seller's market.
Price Position
Aligned with the market — fair pricing for the comps.
Active Properties (5)
Active Comparables
| Address | City | Year | BD | BTH | SqFt | LotSz | LP/SqFt | LP | DIM | Score |
|---|---|---|---|---|---|---|---|---|---|---|
| 44638 13th | Lancaster | 1978 | 3 | 2 | 1,481 | 7,133 | $287 | $425,000 | 27 | 92 |
| 44721 Benald Street | Lancaster | 1970 | 3 | 2 | 1,426 | 7,152 | $315 | $449,900 | 26 | 90 |
| 1800 Sierra View | Lancaster | 1990 | 3 | 2 | 1,316 | 6,097 | $304 | $399,999 | 7 | 90 |
| 1705 Lightcap Street | Lancaster | 1990 | 3 | 2 | 1,644 | 7,197 | $271 | $445,000 | 132 | 87 |
| 44630 17th E, | Lancaster | 1990 | 3 | 3 | 1,581 | 5,790 | $240 | $380,000 | 90 | 86 |
| Total: 5 · Average | 3.0 | 2.2 | 1,489.6 | 6,673.8 | $283.4 | $419,979.8 | 56.4 | |||
| Median | 1,481 | $425,000 | ||||||||
Closed Properties (5)
Closed Comparables
| Address | City | Year | Date | BD | BTH | SqFt | LotSz | LP | SP | SP/SqFt | SP/LP | DIM | Score |
|---|---|---|---|---|---|---|---|---|---|---|---|---|---|
| 44629 Pinon Springs | Lancaster | 1986 | 09/01/2026 | 3 | 2 | 1,263 | 7,133 | $419,999 | $410,000 | $325 | 0.98 | 55 | 93 |
| 44662 Foxboro Court | Lancaster | 1990 | 08/11/2026 | 3 | 2 | 1,379 | 6,258 | $439,999 | $430,000 | $312 | 0.98 | 82 | 92 |
| 1108 Lancaster | Lancaster | 1969 | 10/27/2026 | 3 | 2 | 1,383 | 7,605 | $400,000 | $420,000 | $304 | 1.05 | 67 | 88 |
| 44943 16th | Lancaster | 1989 | 09/07/2026 | 3 | 3 | 1,524 | 6,001 | $399,990 | $435,000 | $285 | 1.09 | 38 | 87 |
| 44213 Fenhold | Lancaster | 1970 | 05/28/2026 | 3 | 2 | 1,426 | 7,148 | $369,900 | $376,000 | $264 | 1.02 | 76 | 86 |
| Total: 5 · Average | 3.0 | 2.2 | 1,395 | 6,829 | $414,200 | $414,200 | $298 | — | 63.6 | ||||
| Median | 1,383 | $420,000 | $420,000 | ||||||||||
Market Analysis
List vs Sale $/SqFt
Sale Price Trend
Days on Market
Sale vs List Price
This analysis was generated automatically from MLS data. For an in-depth, human-reviewed valuation, contact Joseph Sardella at josephsardella@gmail.com.