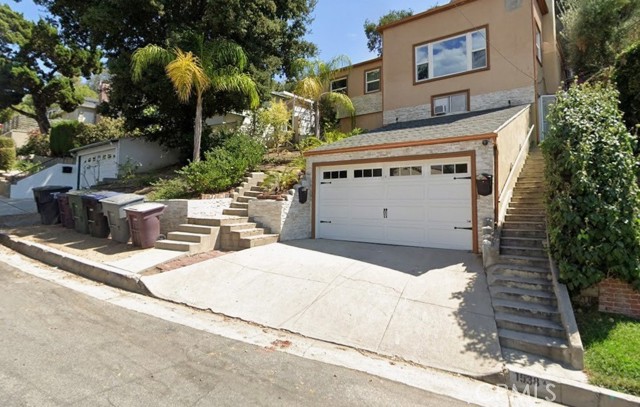
1538 East Maple, Glendale, CA 91205
1538 East Maple, Glendale, CA 91205
Property Description
Centrally located walking distance from a park, surrounded by great schools and community. The property is in distressed sale, short sale with final price and terms subject to lender's final approval. Please email the listing office to arrange the showing and do not show up at the property unannounced.
Features & Amenities
Property Details
Mortgage Calculator
Current Rates
Comparative Market Analysis
Affordable Tier · 5 active · 5 closed
Glendale · Single Family Residence
Listed in line with the median closed sale of $925,000. Price per sqft ($733) is a 14% discount to closed comps ($850). Closed comps sold at 101% of list — strong seller's market.
Price Position
Aligned with the market — fair pricing for the comps.
Active Properties (5)
Active Comparables
| Address | City | Year | BD | BTH | SqFt | LotSz | LP/SqFt | LP | DIM | Score |
|---|---|---|---|---|---|---|---|---|---|---|
| 4528 College View | Los Angeles | 1925 | 2 | 1 | 962 | 11,181 | $986 | $949,000 | 14 | 81 |
| 1534 Broadway | Glendale | 1925 | 3 | 1 | 1,066 | 7,490 | $1,008 | $1.07M | 179 | 81 |
| 811 Fischer Street | Glendale | 1925 | 2 | 2 | 977 | 3,533 | $947 | $925,000 | 98 | 79 |
| 1030 Tyler St | Glendale | 1924 | 2 | 2 | 1,116 | 3,545 | $806 | $899,000 | 121 | 79 |
| 1540 Stanford Drive | Glendale | 1927 | 2 | 1 | 1,046 | 3,312 | $856 | $895,000 | 19 | 78 |
| Total: 5 · Average | 2.2 | 1.4 | 1,033.4 | 5,812.2 | $920.6 | $948,600 | 86.2 | |||
| Median | 1,046 | $925,000 | ||||||||
Closed Properties (5)
Closed Comparables
| Address | City | Year | Date | BD | BTH | SqFt | LotSz | LP | SP | SP/SqFt | SP/LP | DIM | Score |
|---|---|---|---|---|---|---|---|---|---|---|---|---|---|
| 807 S Verdugo Rd | Glendale | 1940 | 04/22/2026 | 2 | 2 | 1,311 | 5,567 | $924,888 | $878,370 | $670 | 0.95 | 86 | 87 |
| 808 Verdugo Road | Glendale | 1927 | 02/20/2026 | 2 | 1 | 1,260 | 4,102 | $927,000 | $927,000 | $736 | 1.00 | 0 | 85 |
| 5233 Lockhaven Avenue | Los Angeles | 1921 | 06/24/2026 | 3 | 1 | 1,172 | 6,649 | $998,000 | $925,000 | $789 | 0.93 | 25 | 82 |
| 3205 Palmer Drive | Los Angeles | 1942 | 12/02/2025 | 2 | 1 | 893 | 4,500 | $749,900 | $857,000 | $960 | 1.14 | 41 | 79 |
| 5011 El Verano Avenue | Los Angeles | 1915 | 11/18/2025 | 2 | 1 | 949 | 3,852 | $995,000 | $1.04M | $1,096 | 1.04 | 40 | 74 |
| Total: 5 · Average | 2.2 | 1.2 | 1,117 | 4,934 | $925,474 | $925,474 | $850.2 | — | 38.4 | ||||
| Median | 1,172 | $925,000 | $925,000 | ||||||||||
Market Analysis
List vs Sale $/SqFt
Sale Price Trend
Days on Market
Sale vs List Price
This analysis was generated automatically from MLS data. For an in-depth, human-reviewed valuation, contact Joseph Sardella at josephsardella@gmail.com.